
Figure 2. Normalized Mu insertion counts and regional efficiency of transposition.
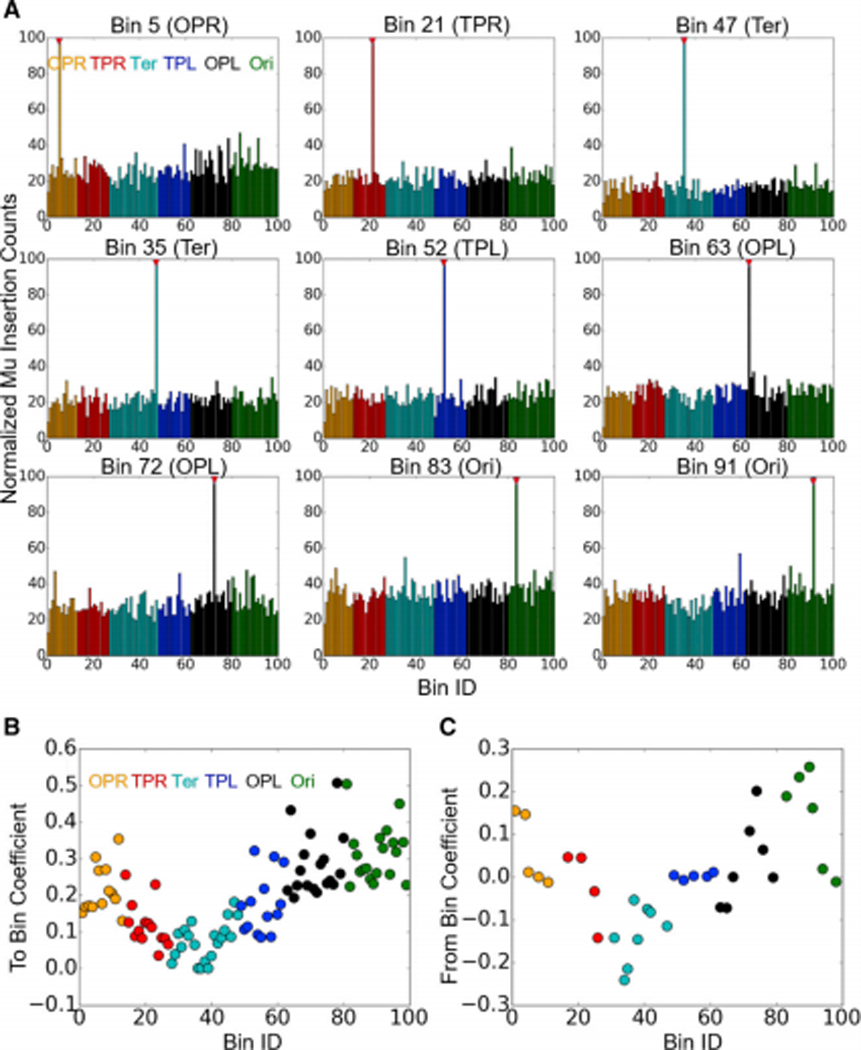
(A) Mu insertion counts for nine representative prophages located around the E. coli genome after one round of transposition. The number of insertions have been normalized to the read depth of each bin. Initial Mu positions (red triangles) were given an arbitrarily large value to emphasize their location along the x-axis. (B) Coefficients of the To Bin and From Bin contributions to the LASSO model. For all 100 bins, Mu’s ability to insert into that bin irrespective of its starting locations is measured by the To Bin coefficient. Positive values mean that it is easier to insert into that Bin compared to the global average. Similarly, From Bin coefficients measure Mu’s ability to leave that and insert into the remaining 99 bins.