
Figure 3. Locations of significant bin interactions implied by Mu transposition data.
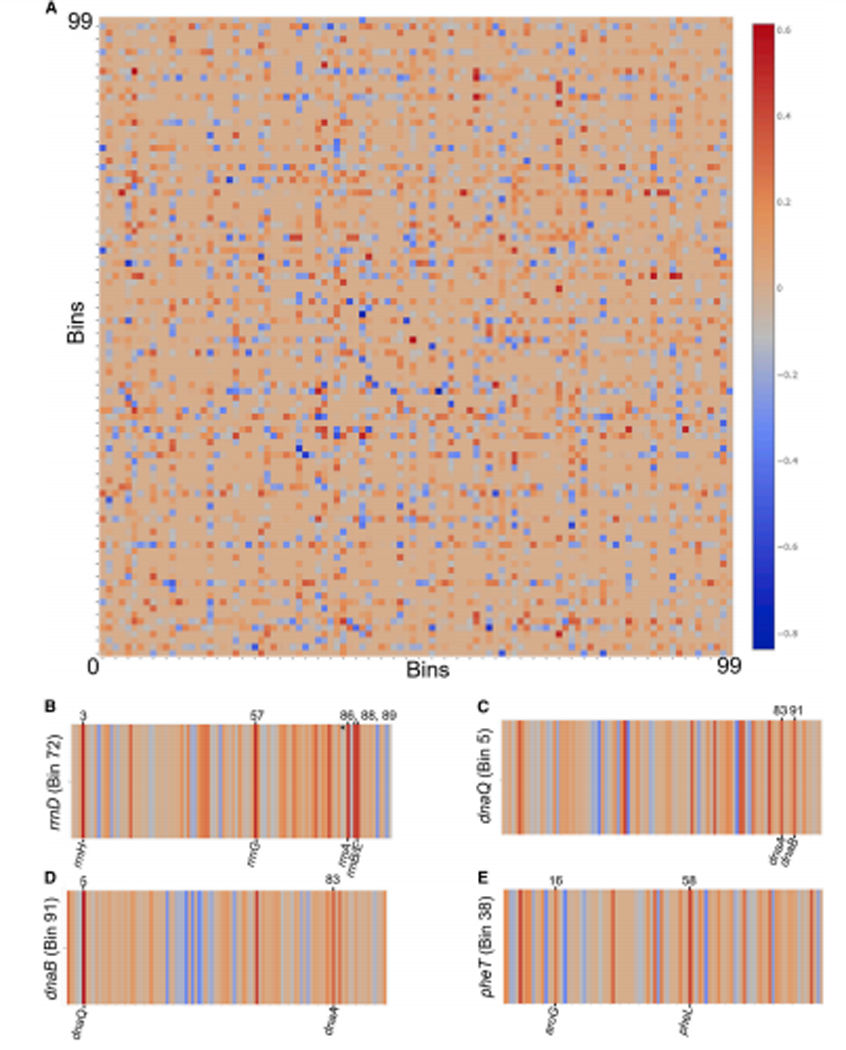
(A) Pairwise Bin:Bin interaction coefficient matrix. The x- and y-axes correspond to the 100 Bins representing the chromosome. Each pixel in the matrix is colored to indicate the coefficient value for that specific Bin:Bin interaction. Positive values of interaction indicate a higher degree of interaction compared to the global average. (B-E) Enlarged views of the rows of the matrix from panel A corresponding to Bins 5, 38, 72, and 91 (as labeled); color scale is identical to panel A. The asterisk in Bin 72 is used to indicate the low-level interaction with Bin 84 (rrnC).