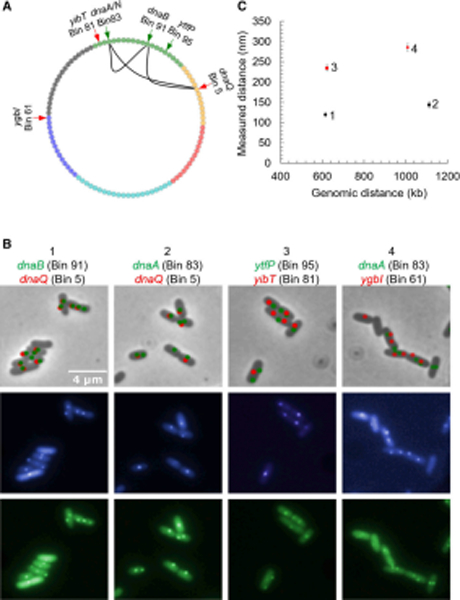
Figure 4. Fluorescent microscopy confirms gene clustering predicted from Mu transposition analysis.

(A) In the cartoon, arrows point to positions of the various parS sites placed near the indicated genes in the listed chromosome bins, and visualized with GFP- (green arrow) and CFP-ParB (red arrow). (B) The top bright field panels represent CFP puncta in red and GFP puncta in green, from fluorescence data obtained from the two panels immediately underneath. Panel 1 shows data for DW151, where parS sites were positioned next to dnaB and dnaQ in the indicated bins, ~615 kb apart. Panel 3 is a control for panel 1, where the parS sites are 622 kb apart, located near ytfP and yjbT genes (DMW153). Panel 2 has parS sites located near the replisome genes dnaA and dnaQ located 1.1 Mb from one another (DMW155). Panel 4 is a control for panel 2, where the parS sites are ~1.0 Mb apart located near the genes dnaA and ygbI (DMW157). (C) The measured physical distances between the pairwise labeled parS loci were calculated and compared between the controls and dna genes. The identifying numbers (1–4) correspond to the panel numbers in B. Error bars represent the 95% confidence interval assuming normality. 1 (N=408) and 2 (N=514) appear to be much closer than their respective controls 3 (N=523) and 4 (N=569).
