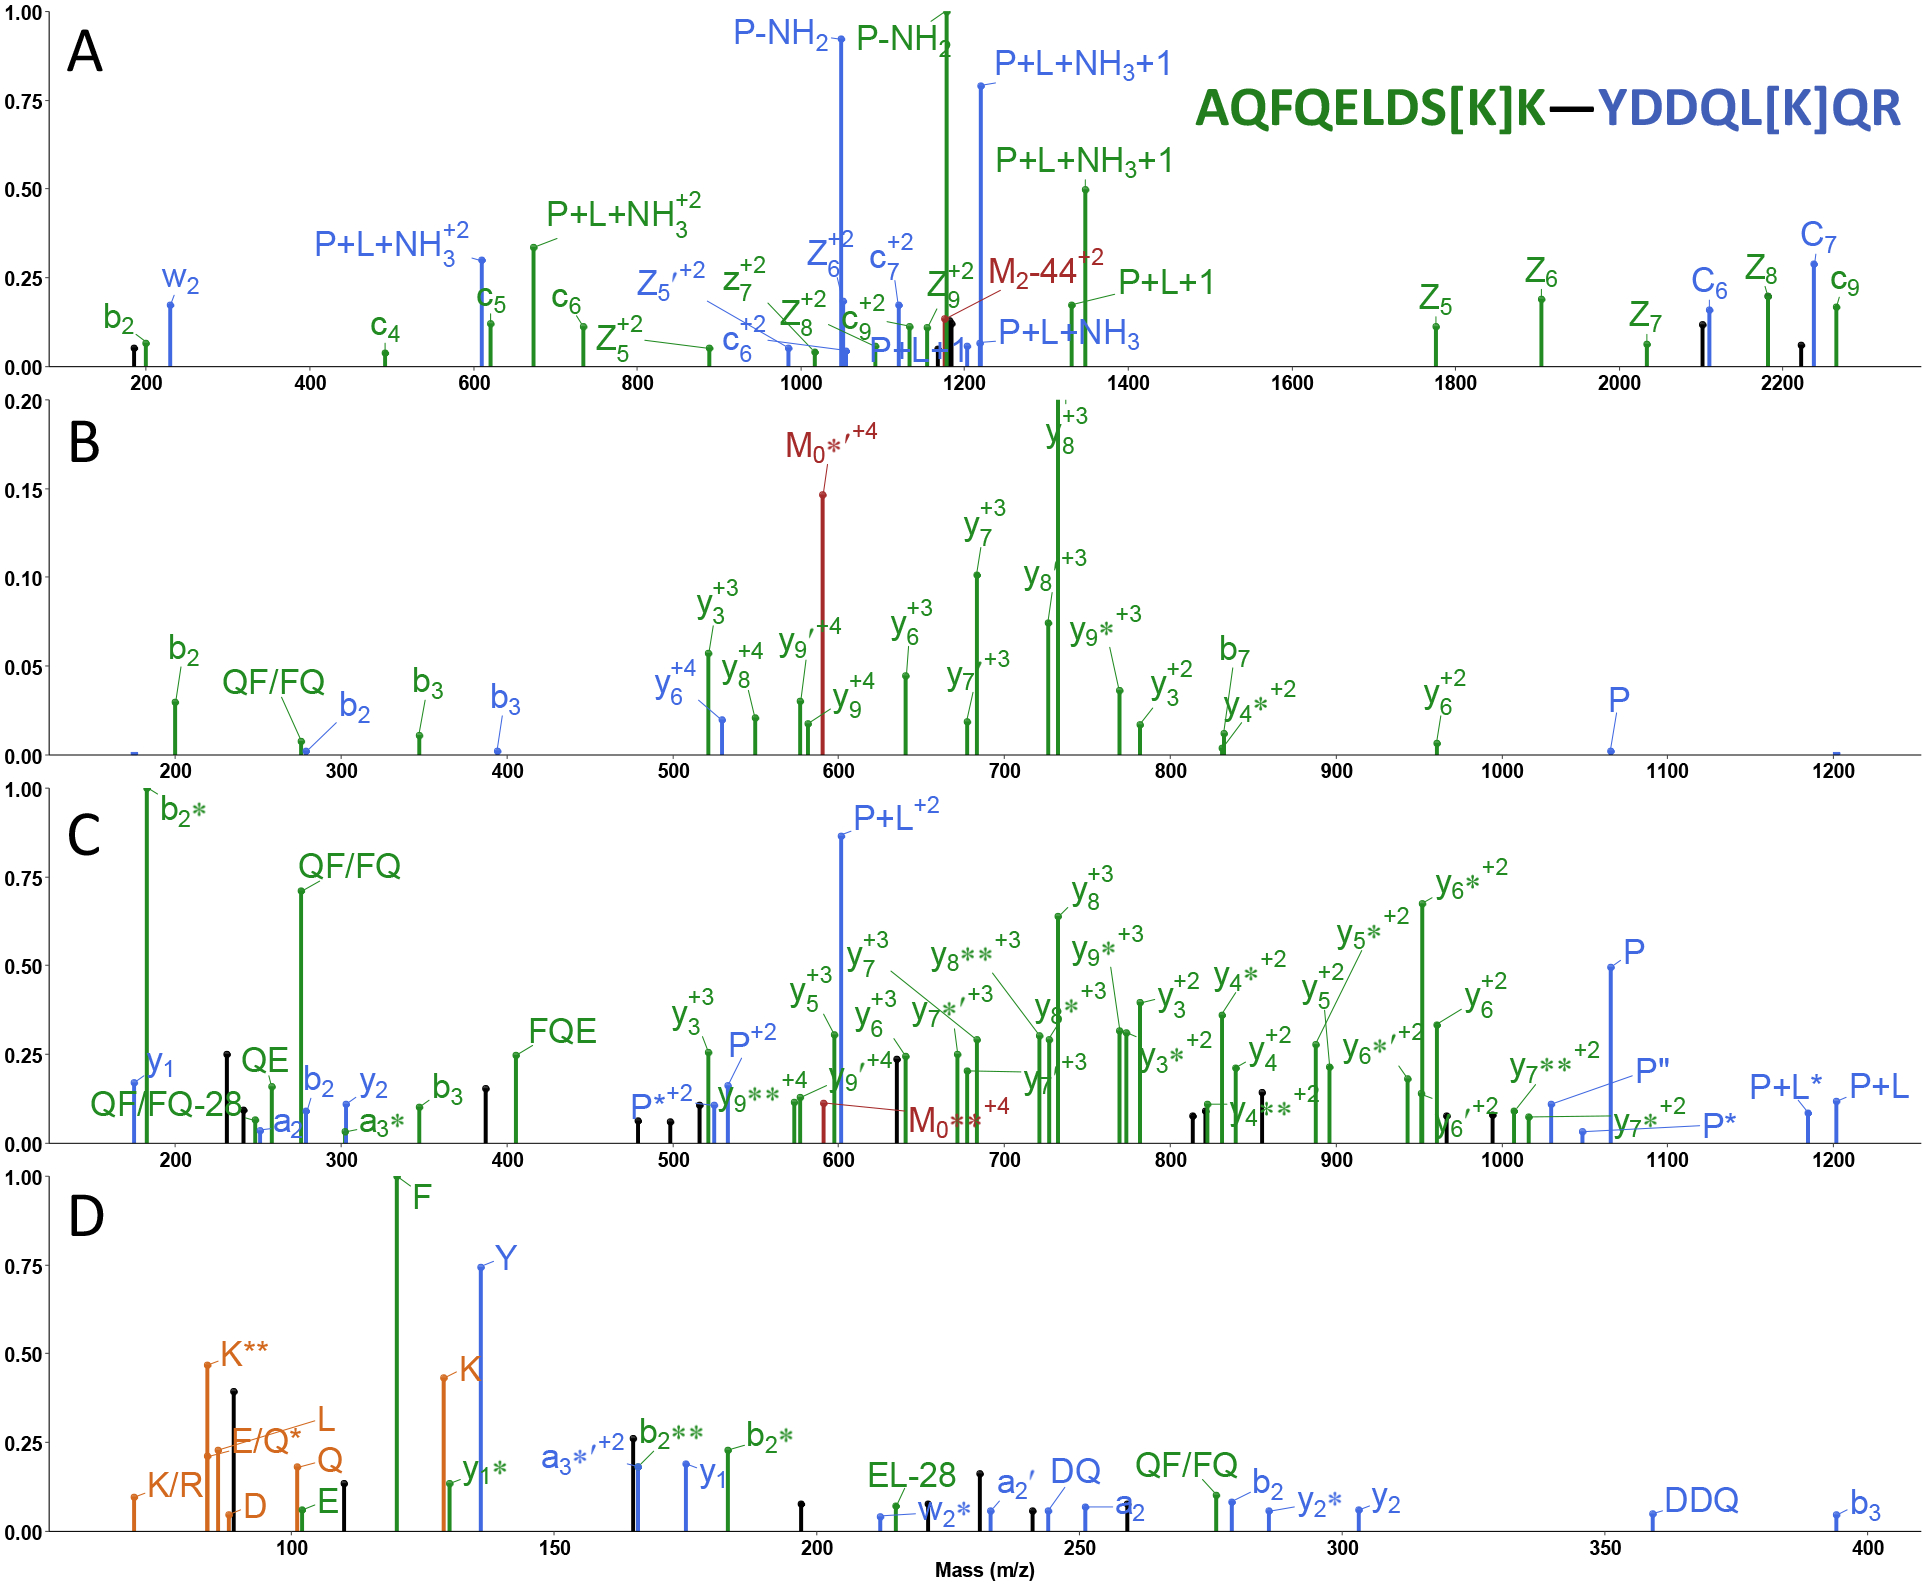
Figure 2.

MS2 spectra of the cross-link AQFQELDS[K]K―YDDQL[K]QR between proteasome proteins Rpn9 and Rpt4 fragmented by (A) EThcD, (B) CID, (C) HCD and (D) hcd methods. Green and blue peaks are formed following cleavage of peptides α and β, respectively; peaks associated with the precursor ion are in red; orange peaks are immonium ions attributable to either peptide; unassignable peaks are in black. Neutral losses of ammonia and water are denoted by an asterisk (*) and prime (‘) respectively. c+1 and z+1 ions are represented as C and Z ions. Subscripts following M represent the number of hydrogen atoms lost from the precursor ion after electron capture.
