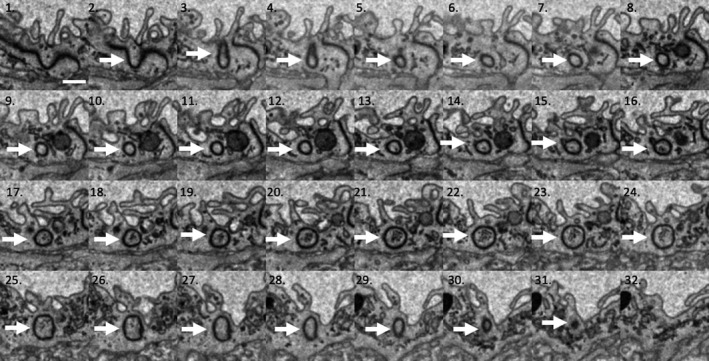
FIGURE 2.

A set of SBF SEM serial images from the series stack reconstructed in Figure 1. This shows an IEP beginning as a fold in the cell–cell junction in image 1 and disappearing in image 32. All images are 50 nm apart, so the overall length of the IEP is approximately 1.5 μm. The IEP is identified by an arrow sitting within the acceptor endothelial cell. The capillary lumen is at the top of each picture. Scale bar: (image 1) .5 μm
