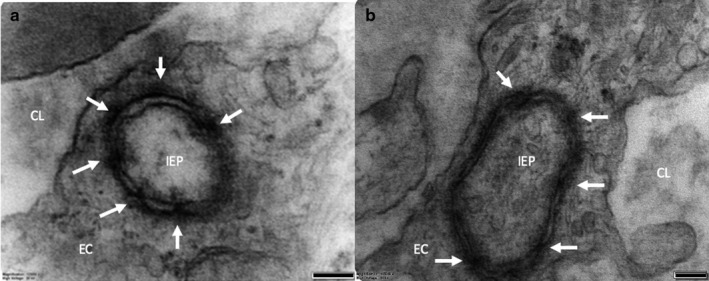
FIGURE 4.

TEM images showing probable IEP cross‐sections in two different placentae (a and b). Junctional complexes are indicated by the white arrows connecting the IEP and the recipient cell. In (a), the membranes on the lower right‐hand quadrant of the IEP are unclear, which is likely due to the membranes not being perpendicular to the plane of the sample and thus not distinguishable. CL, endothelial lumen; EC, endothelial cell; IEP, intracytoplasmic process. Scale bars: 100 nm
