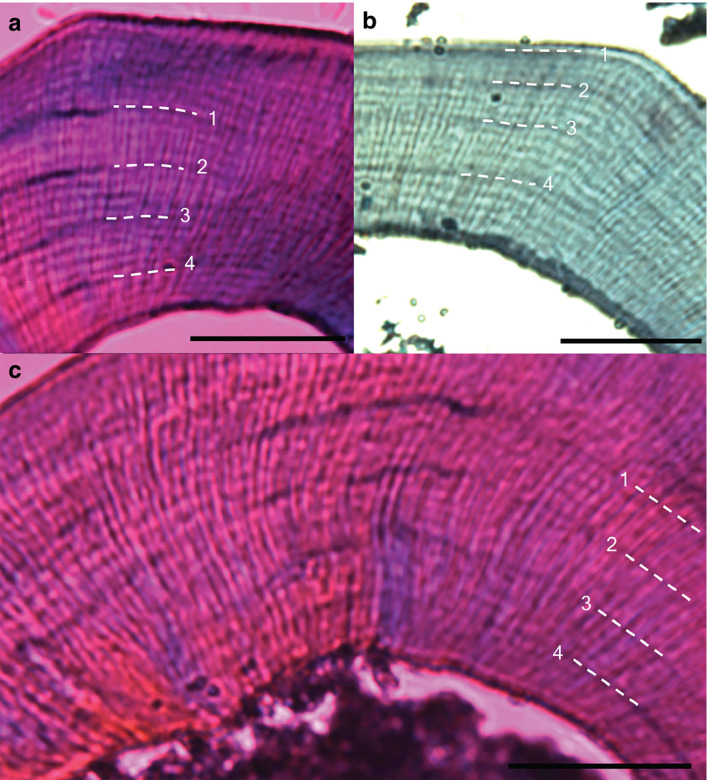
FIGURE 8.

Daily growth lines in decalcified sections from wild‐type, heterozygous and homozygous Bmal1 mice from replicate 1. Numbers and dotted white lines denote lead labels every 4 days, followed by sacrifice 4 days later. Mice were transferred from 12:12 light/dark cycle into constant darkness after injection 2. (a) Bmal1+/+ mouse, (b) Bmal1+/− mouse, (c) Bmal1− /− mouse. Scale bars: (a) 200 μm; (b,c) 100 μm
