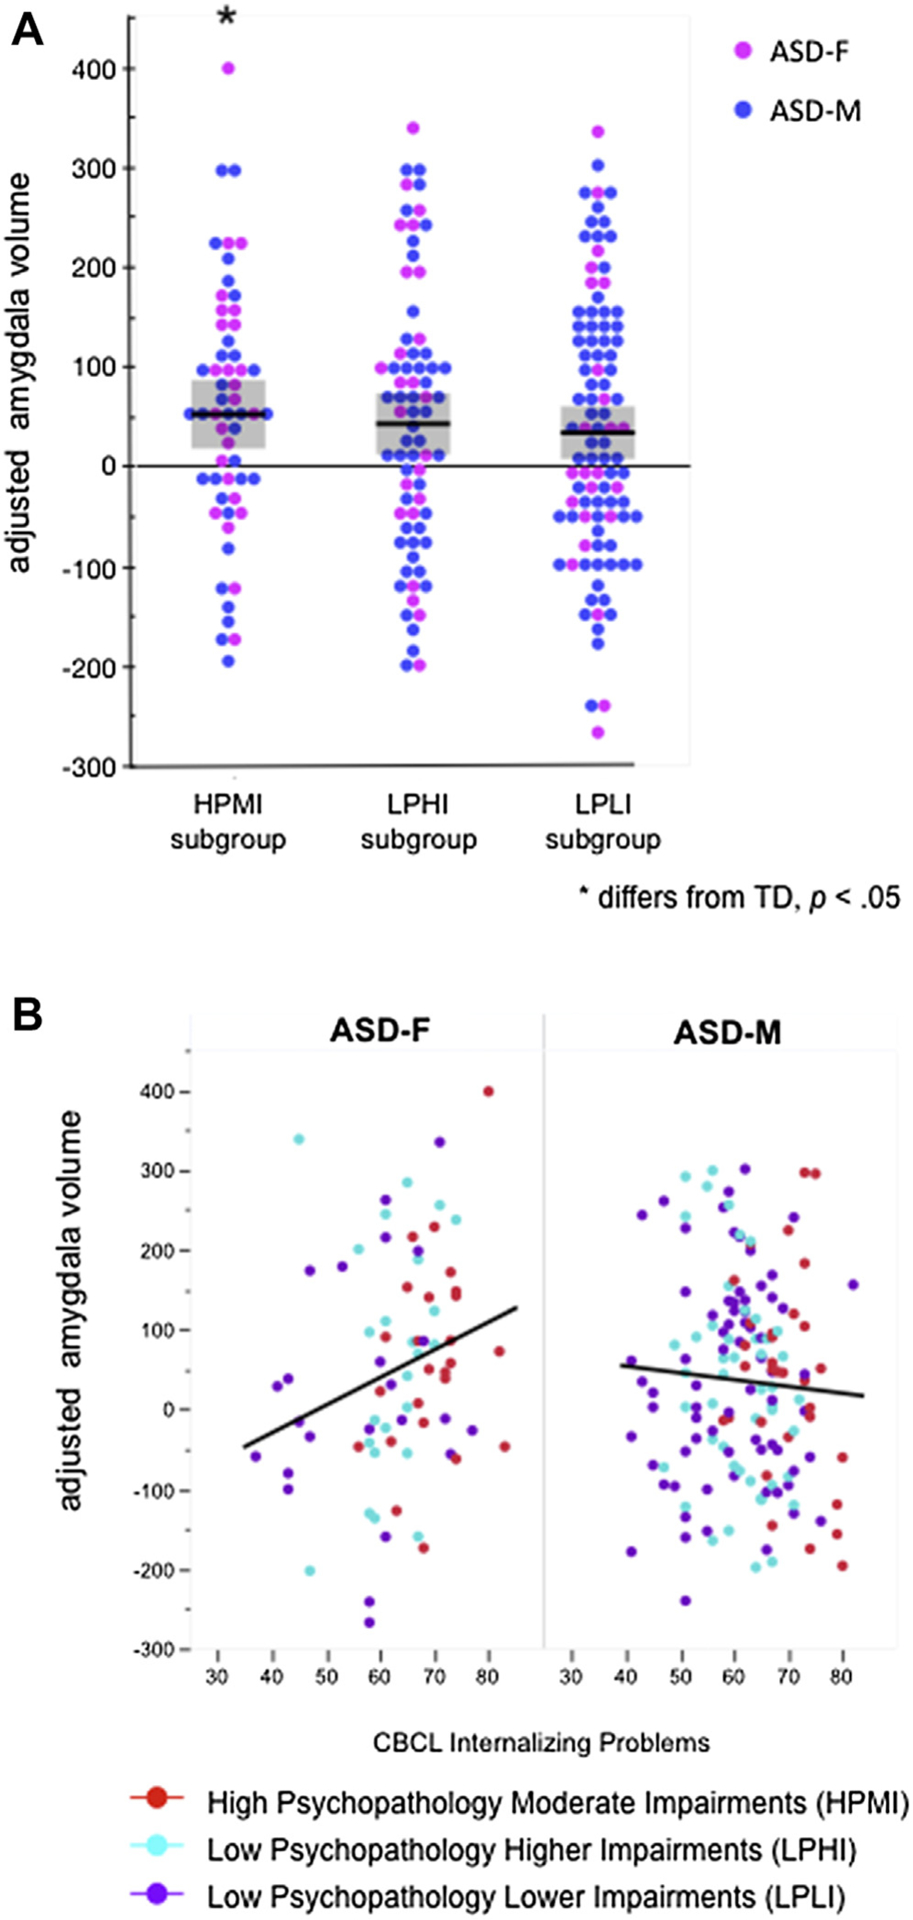
FIGURE 2. Amygdala Volume and Autism Spectrum Disorder (ASD) Subgroups.

Note: (A) Right amygdala volumes (adjusted for sex, age, and total cerebral volume) by latent profile subgroups. Only the HPMI group differs from TD controls. (B) CBCL internalizing problems score is associated with right amygdala volume in female participants with ASD but not in male participants. Colors represent LPA group assignment. Amygdala volumes were adjusted by generating residuals for all participants using the estimates obtained from a regression model (using sex, age, and total cerebral volume as predictors) for the control group only. Each residual represents the deviation for each participant’s observed amygdala volume from what would be expected of a control participant with the same age, sex, and total cerebral volume. ASD = autism spectrum disorder; HPMI = High Psychopathology Moderate Impairments; LPLI = Low Psychopathology Lower Impairments; LPHI = Low Psychopathology Higher Impairments; LPA = latent profile analysis; TD = typically developing; CBCL = Child Behavior Checklist; ASD-F = female participant with ASD; ASD-M = male participant with ASD.
