
Figure 2.
Position of ANT ChIP‐Seq peaks relative to the closest gene.
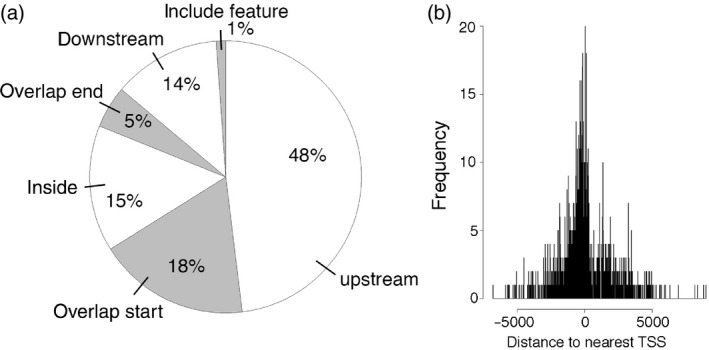
(a) Pie chart showing the position of ANT ChIP‐Seq binding peaks relative to the closest gene. Almost half of the peaks are upstream of the closest gene (48%). The remaining peaks either overlap with the start of the gene (18.0%), are within the gene (15%), overlap with the end of the gene (5%), are downstream of the gene (14%) or overlap the entire gene (1%).
(b) Position of ANT binding peak relative to the transcriptional start site (TSS) of the closest gene.