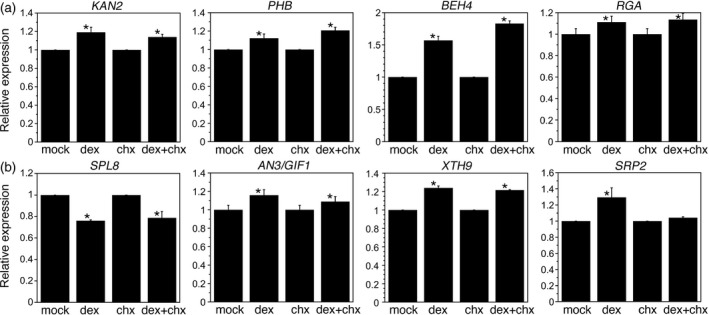
Figure 5.

Several differentially expressed (DE) genes tested show protein synthesis‐independent gene expression changes after induction of ANT activity in 35S:ANT‐GR. Graphs show the relative expression of KAN2, PHB, BEH4, RGA, SPL8, AN3/GIF1, XTH9 and SRP2 after mock, dexamethasone (dex), cycloheximide (chx) and dex + chx treatments. Relative expression refers to mRNA levels in dex samples compared with mock samples and mRNA levels in dex + chx samples compared with chx samples. *The dex samples statistically differ from mock samples and the dex + chx samples statistically differ from chx samples, as determined by Students t‐test (P < 0.05). mRNA levels were measured 4 h after treatment. Graphs show means ± SDs of two biological replicates.
