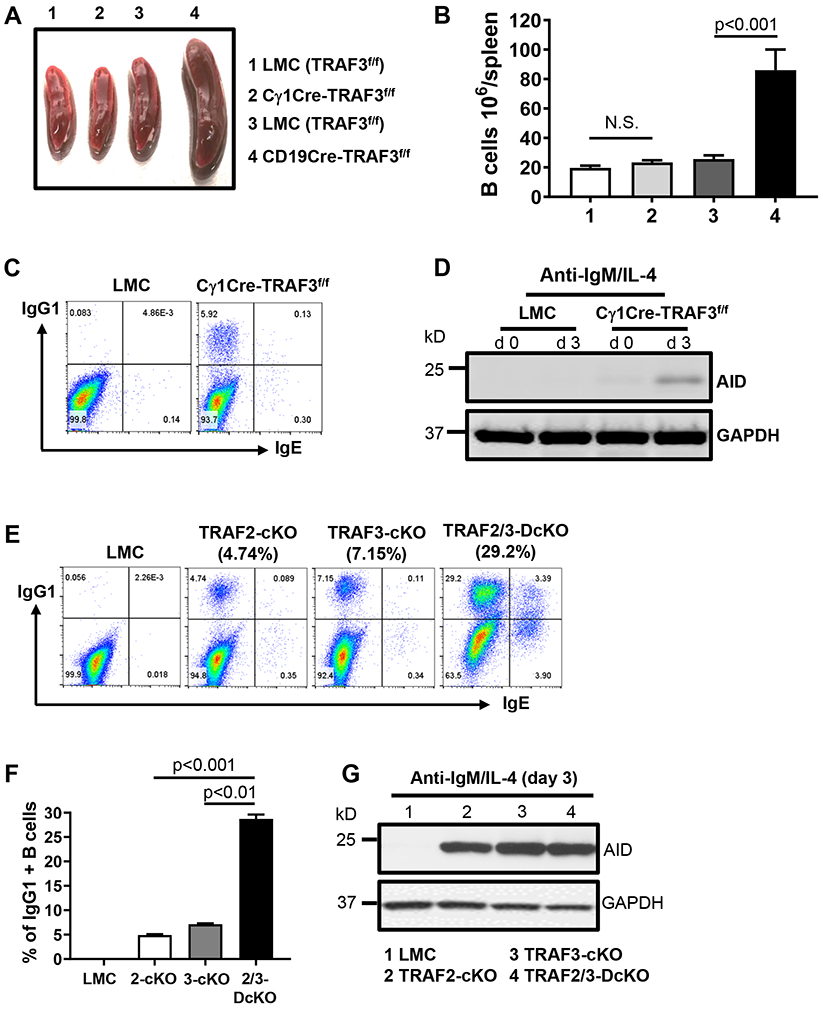
Figure 2. TRAF3 restricts BCR-induced CSR autonomously and TRAF2 and TRAF3 cooperatively inhibit BCR’s ability to induce CSR.

(A) Representative image of mouse spleens with indicated genotypes (group 1-4, n≥15/group, 8-12 weeks old). (B) Quantification of the number of splenic B cells in mice with indicated genotypes as labeled in (A) (n=5/group). (C) Representative flow data showing day4 IgG1 and IgE CSR induced by anti-IgM/IL-4 in indicated B cells. (D) Representative Western blot data showing AID protein expression induced by anti-IgM/IL-4 at day3 in indicated B cells. GAPDH as loading control. Data are representative of 3 to 4 independently repeated experiments. (E) Flow data showing day4 IgG1 and IgE CSR induced by anti-IgM/IL-4 in indicated B cells. (F) Quantification of IgG1+ B cell percentage from triplicates of one representative experiment. (G) Western blot showing AID protein expression induced by anti-IgM/IL-4 in indicated B cells. TRAF3-cKO, CD19Cre-Traf3f/f; TRAF2-cKO, CD19Cre-Traf2f/f; TRAF2/3-DcKO, CD19Cre-Traf2f/f/Traf3f/f. Data are representative of 3-6 independently repeated experiments.
