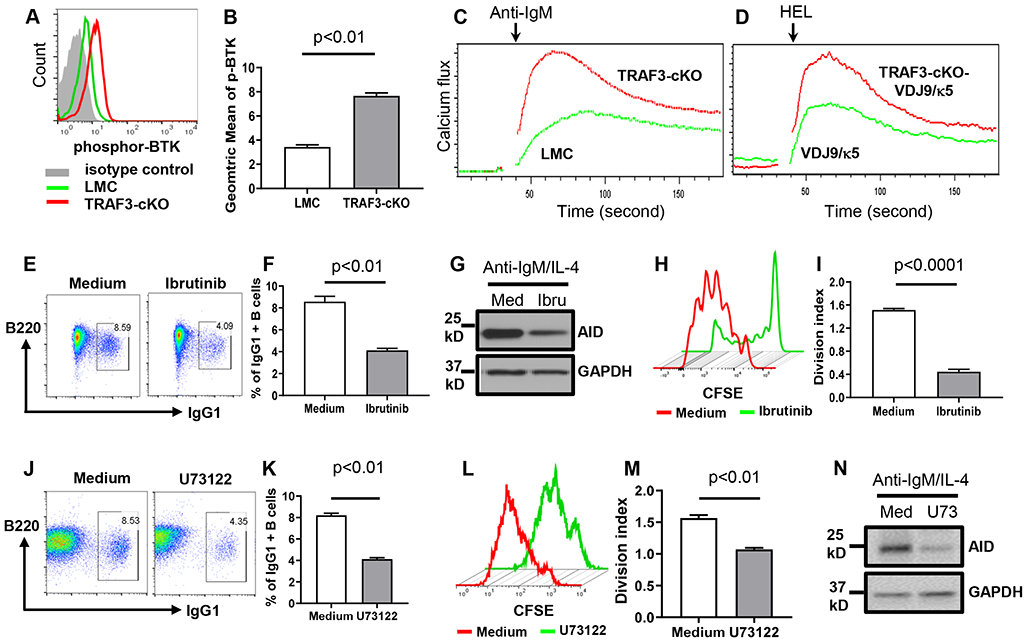
Figure 3. TRAF3 deficiency increases the BCR proximal signaling intensity required for BCR-induced AID expression and CSR.

(A) Flow data showing phospho-BTK (p-BTK) induced by anti-IgM in indicated B cells. (B) Quantification of geometric mean of p-BTK intensity from duplicates of one representative experiment. (C and D) Flow data from duplicates of one experiment showing Ca2+ flux induced by anti-IgM (C) or HEL (D) in indicated B cells. (E to I) TRAF3-cKO B cells pre-treated with Ibrutinib (Ibru) (5nM) or medium (Med) then stimulated with anti-IgM/IL-4. (E) Flow data showing day4 IgG1 CSR. (F) Quantification of IgG1+ B cell percentage from triplicates of one representative experiment. (G) Western blot data showing AID protein expression at day3. (H) Proliferation pattern of TRAF3-cKO B cells as treated in (E). (I) Quantification of division index from triplicates of one representative experiment. (J to N) TRAF3-cKO B cells pretreated with U73122 (U73) (0.2 μM) or medium (Med) then stimulated with anti-IgM/IL-4. (J) Flow data showing day4 IgG1 CSR. (K) Quantification of IgG1+ B cell percentage from triplicates of one representative experiment. (L) Proliferation pattern of TRAF3-cKO B cells as treated in (J). (M) Quantification of division index from triplicates of one representative experiment. (N) Western blot showing AID protein expression at day3. TRAF3-cKO, CD19Cre-Traf3f/f. Data are representative of 3-6 independently repeated experiments.
