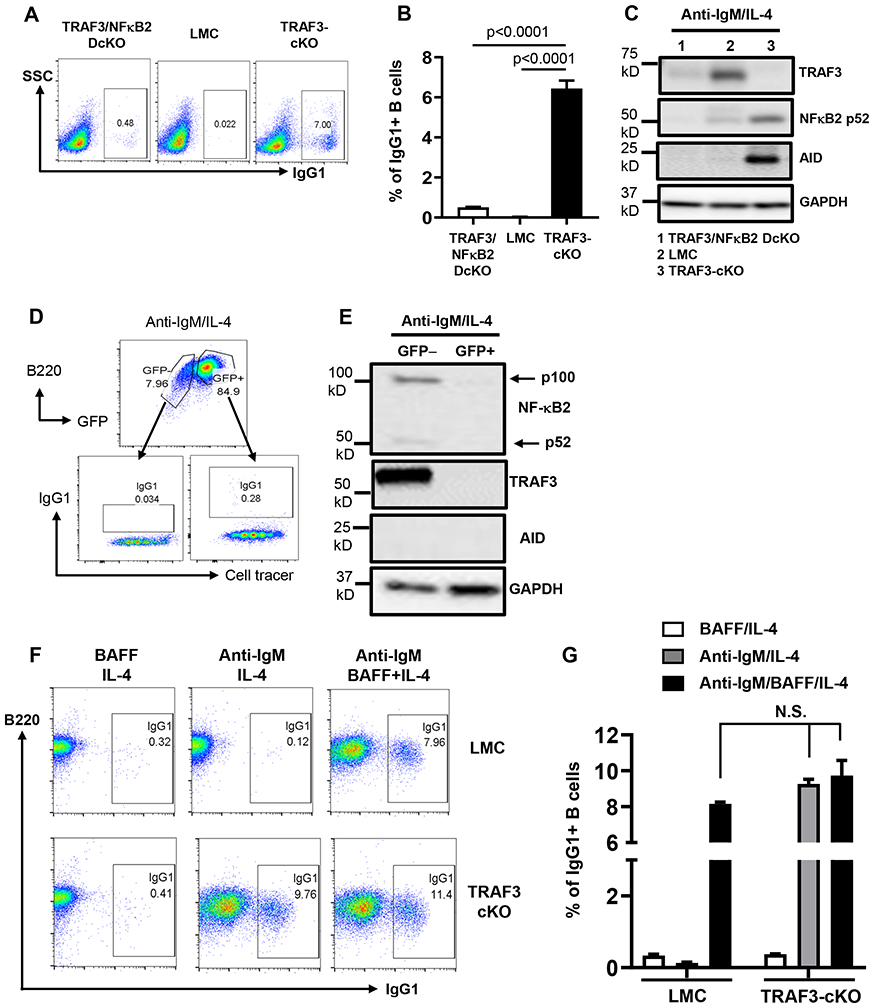
Figure 5. NF-κB2 is required for BCR-induced CSR.

(A) Flow data showing day 4 IgG1 CSR induced by anti-IgM/IL-4 in indicated B cells. (B) Quantification of IgG1+ B cell percentage from triplicates of one representative experiment. (C) Western blot data showing indicated protein expression induced by anti-IgM/IL-4 at day3 in indicated B cells. (D) Representative flow data showing GFP expression (a marker for NF-κB2 deletion) in CD19Cre-TRAF3f/f/NF-κB2f/f B cells and day4 IgG1 CSR in GFP+ and GFP− B cells stimulated by anti-IgM/IL-4. Cell tracer indicates cell proliferation. (E) Representative Western blot data showing NF-κB2, TRAF3 and AID expression in CD19Cre-TRAF3f/f/NF-κB2f/f GFP− and GFP+ B cells stimulated with anti-IgM/IL-4 for 3 days. GAPDH as loading control. (F and G) The role of BAFF-BAFFR pathway in CSR of TRAF3-cKO B cells. (F) Representative flow data showing day 4 IgG1 CSR induced by indicated stimuli (IL4, 10 ng/ml; anti-IgM, 10 μg/ml; BAFF, 1 μg/ml). (G) Quantification of IgG1+ B cell percentage from triplicates of one representative experiment. N.S., not significant, Two-way ANOVA analysis between indicated groups. TRAF3-cKO, CD19Cre-Traf3f/f; TRAF3/NF-κB2-DcKO, CD19Cre-Traf3f/f-NF-κB2f/f. Data are representative of 3-6 independently repeated experiments.
