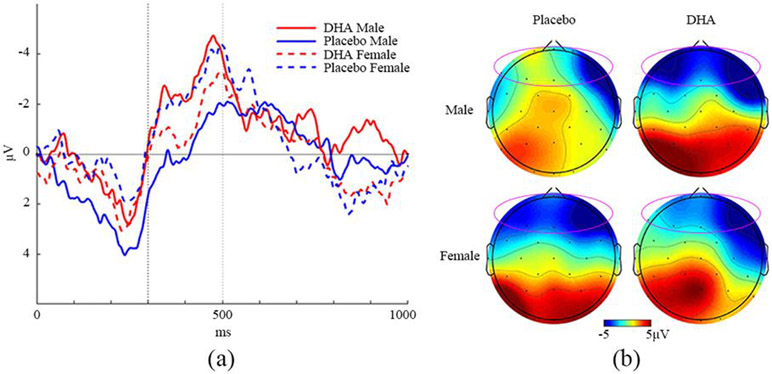
Figure 4.
N2 condition difference ERP waveforms and topographies. (a) Grand average of difference ERP waveforms (No-Go minus Go condition). The N2 component analysis temporal window is between 300-500ms (indicated by vertical dash lines). (b) Topography difference between No-Go and Go condition (t = 485 ms). Electrodes used in N2 component are circled.

