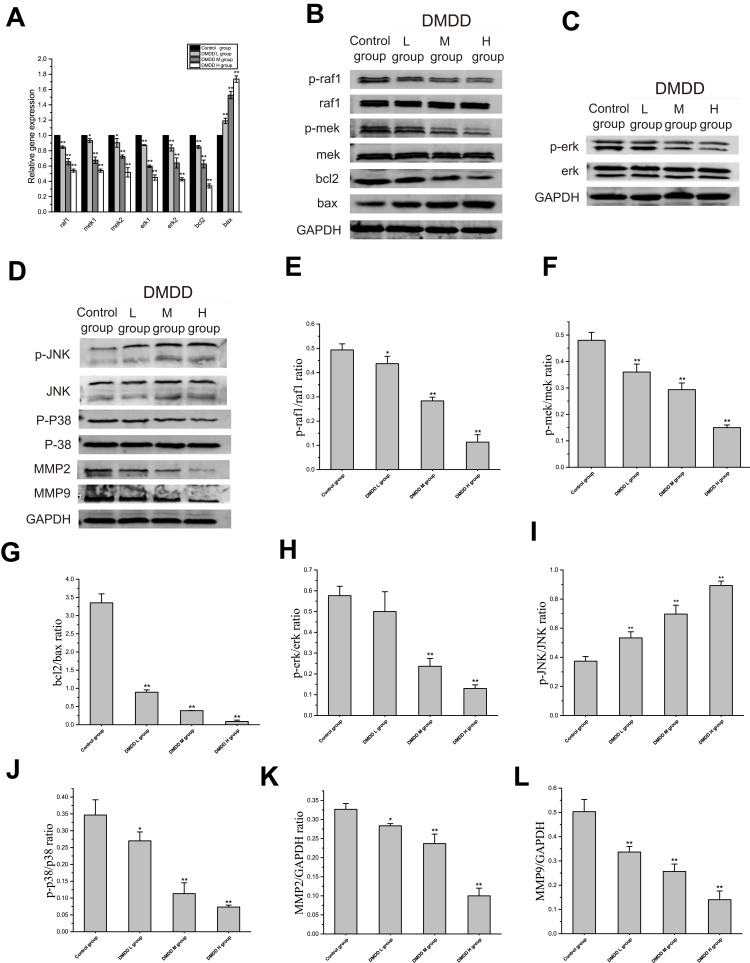
Figure 6.
Effect of DMDD on MAPK signaling pathway of 4T1 cells.
Notes: (A) Relative quantitative real-time PCR analysis was applied to investigate related gene expressions. (B–L) Western blot analysis was applied to detect related protein expressions. (B) Because the bands of protein p-raf1, raf, p-mek, mek, bcl2, bax, GAPDH were carried out at the same time on different SDS-PAGE gels under the same experimental conditions (include the same batch of protein, the same amount of loading, the same conditions for electrophoresis and transfer, etc.). So they are sharing the same GAPDH. (D) Because the bands of protein P-JNK, JNK, P-P38, P38, MMP2, MMP9, GAPDH were carried out at the same time on different SDS-PAGE gels under the same experimental conditions (including the same batch of protein, the same amount of loading, the same conditions for electrophoresis and transfer, etc.). So they are sharing the same GAPDH. Data are presented as mean ± SD of three experiments. (*P < 0.05, **P < 0.01, DMDD vs control). DMDD L group: 6 μM; DMDD M group: 8 μM; DMDD H group: 10 μM.

