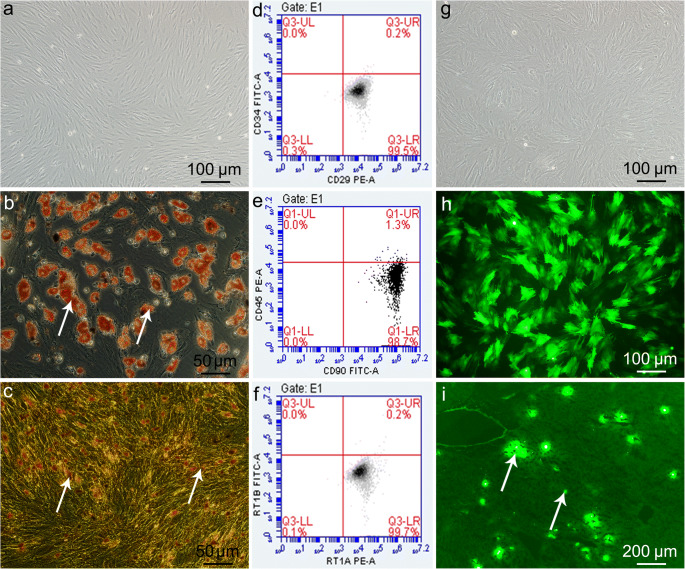
Fig. 1.
BMMSC morphology, phenotype, differentiation characteristics, and colonization. a Passage 3 BMMSCs (scale bar = 100 μm). b BMMSC adipogenic differentiation shows typical red lipid droplets in cells (white arrows; scale bar = 50 μm). c BMMSC osteogenic differentiation shows intracellular black calcium salt deposition (white arrows; scale bar = 50 μm). d–f Flow cytometry of BMMSC surface markers: CD29, CD34, CD45, CD90, RT1A, RT1B. g GFP-transfected BMMSCs, i.e., GFP-BMMSCs, in bright field (scale bar = 100 μm). h GFP-BMMSCs in fluorescence field; GFP-expressing BMMSCs was > 85% (scale bar = 100 μm). i GFP-BMMSCs (white arrows) plus 6-h NMP DCD liver frozen section in fluorescence field; BMMSCs colonized the hepatic sinusoids (scale bar = 200 μm). GFP green fluorescent protein, BMMSCs bone marrow mesenchymal stem cells, DCD donation after circulatory death

