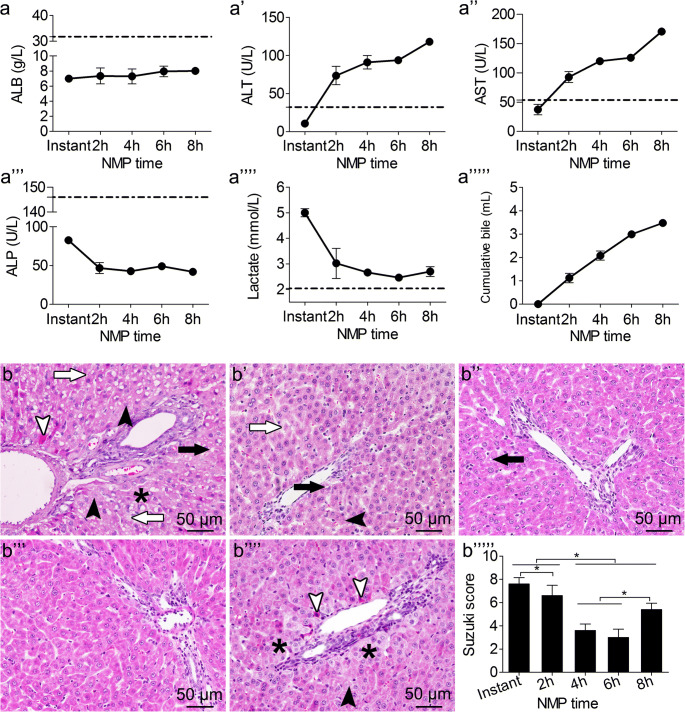
Fig. 2.
Effects of rat NMP system on DCD liver. (a-a””’) ALB, ALT, AST, ALP levels; lactate clearance; and bile production. ALT and AST levels were significantly different among the time points except for hour 4 and 6. Lactate gradually decreased and showed an increasing trend after hour 6; lactate at hour 6 was significantly lower than that at hour 2. (b–b””) Liver pathology and Suzuki’s scores (b””’): HE-stained liver at: (b) the instant of perfusion, (b’) hour 2 after perfusion, (b”) hour 4 after perfusion, (b”’) hour 6 after perfusion, (b””) hour 8 after perfusion. Liver pathology was best at hour 4 and 6; hepatocyte edema (black asterisks), eosinophilic degeneration (white arrowheads), and hepatocyte necrosis (black arrowheads) were observed at hour 8 (scale bar = 50 μm, n = 5) (black arrows indicate hepatocyte vacuolization, white arrows indicate sinusoid congestion). *p < 0.05. ALB albumin, ALT alanine aminotransferase, AST aspartate aminotransferase, ALP alkaline phosphatase, NMP normothermic machine perfusion, HE hematoxylin–eosin, DCD donation after circulatory death

