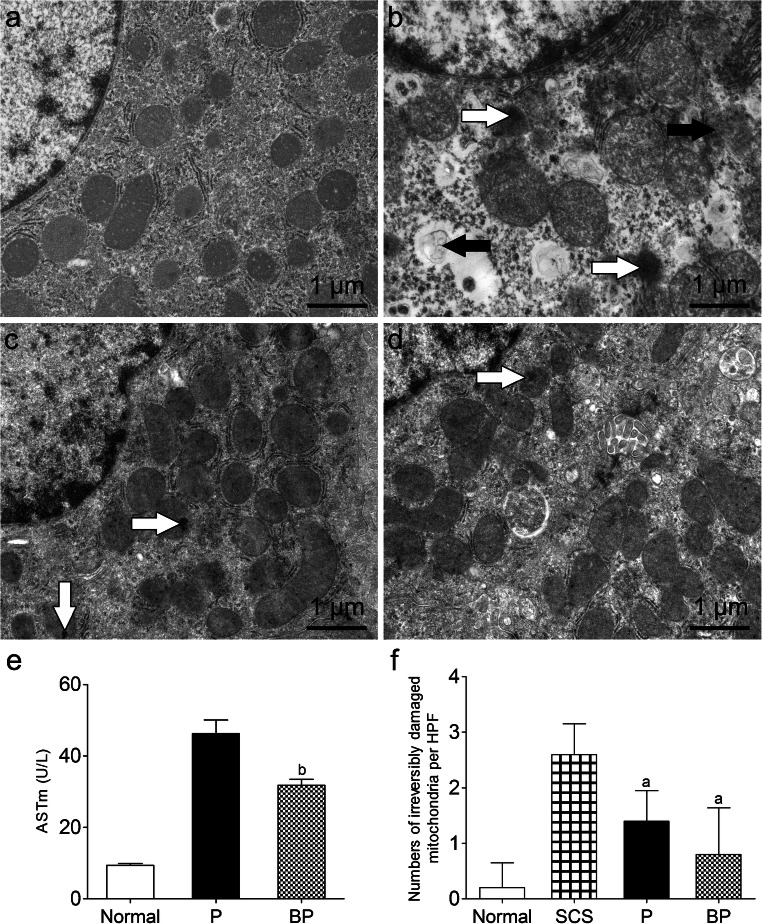
Fig. 4.
Mitochondrial ultrastructure and damage in DCD liver. a Mitochondrial morphology in the (a) normal group, b SCS group, c P group, d BP group. The SCS group showed more severe nucleic swelling, mitochondrial edema, vacuolization, irreversible damage (white arrows, flocculated density) and partial mitochondrial lysis (black arrows). Mitochondrial cristae were disrupted (almost disappeared) in SCS liver (scale bar = 1 μm). e ASTm levels in perfusate. The PB group had significantly lower ASTm levels than the P group. f Number of irreversibly damaged mitochondria per HPF. ap < 0.05 vs. SCS group, bp < 0.05 vs. P group. DCD donation after circulatory death, SCS static cold storage, mitochondrial aspartate aminotransferase (ASTm), HPF high-power field; P, NMP; BP, BMMSCs plus NMP

