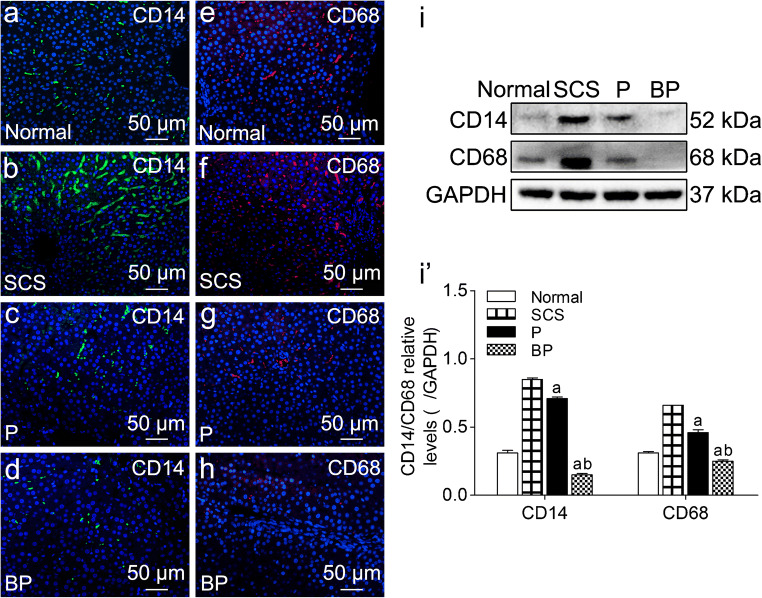
Fig. 5.
Expression of macrophage surface activating molecules in DCD liver tissues. (a–h) Immunofluorescence staining of CD14 and CD68, green indicates CD14, red indicates CD68, blue indicates DAPI-stained nuclei (scale bar = 50 μm). (i, i’) Western blot and quantitative analysis of CD14 and CD68 (n = 5). ap < 0.05 vs. SCS group, bp < 0.05 vs. P group. DCD donation after circulatory death, SCS static cold storage; P, NMP; BP, BMMSCs plus NMP

