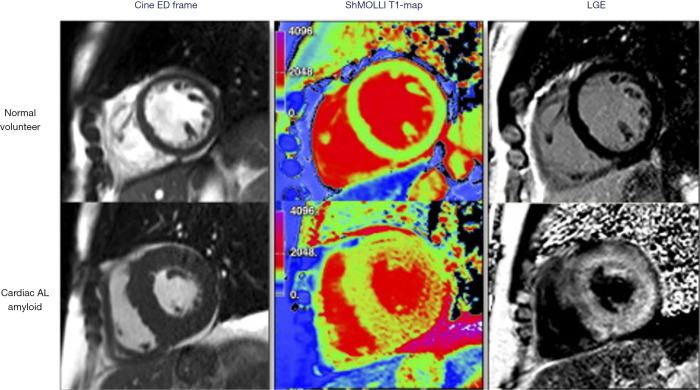
Figure 3.
End-diastolic frame from cine (left panel), ShMOLLI T1 map (middle panel), and LGE images (right panel) in normal volunteer, and cardiac amyloid patient showing elevated myocardial T1 time in amyloid (into the red range of the colour scale) compared to the normal control. LGE, late gadolinium enhancement.

