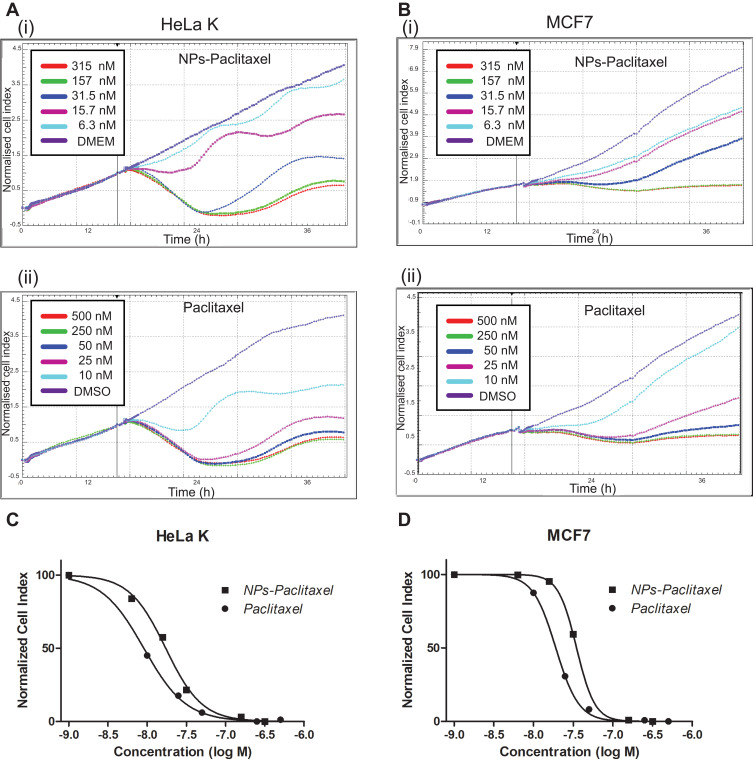
Figure 4.
Monitoring of Paclitaxel-loaded PPSu-PEG NPs cell toxicity versus free Paclitaxel. HeLa K and MCF7 cells were treated with either Paclitaxel-loaded PPSu-PEG NPs, or free Paclitaxel and real-time monitored for 48 h after drug addition, using the RTCA assay. (A) Graphs representing normalized cell index of HeLa K cells treated with (i) Paclitaxel-loaded PPSu-PEG NPs (ii) free Paclitaxel, (B) Graphs representing normalized cell index of MCF7 cells treated with (i) Paclitaxel-loaded PPSu-PEG NPs, and (ii) free Paclitaxel. Cells were treated in duplicates with the indicated concentrations. (C–D) Dose response curves resulting from the RTCA assay for IC50 values of HeLa K (C) and MCF7 cells (D), treated with either Paclitaxel-loaded PPSu-PEG NPs (NPs-Paclitaxel) or free Paclitaxel.

