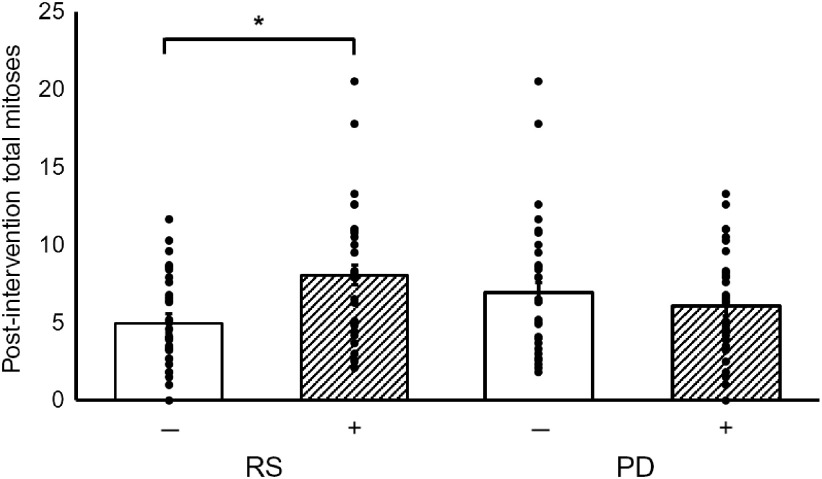
Fig. 1.
Effects of resistant starch (RS) and polydextrose (PD) on total mitoses post-intervention. Data are presented as individual data plots, and bars represent least squares means for data adjusted for pre-intervention total mitoses, age, sex, endoscopy procedure, BMI and smoking status (ANOVA general linear model (GLM)). Error bars represent standard errors of the mean. * Significant effect of the intervention (P < 0·05).

