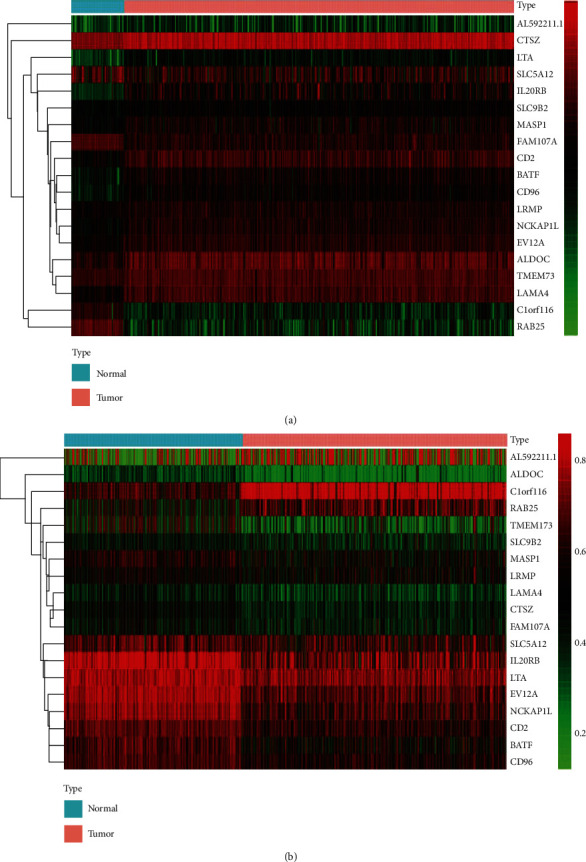
Figure 1.

Heat maps of ccRCC-related aberrant methylation-driven genes. (a) The hierarchical clustering heat map of ccRCC-specific methylation-driven mRNAs. (b) The hierarchical clustering heat map of the methylation level of ccRCC-specific methylation-driven genes. In the figure, red represents highly methylated genes and green represents low methylated genes between ccRCC and normal tissues.
