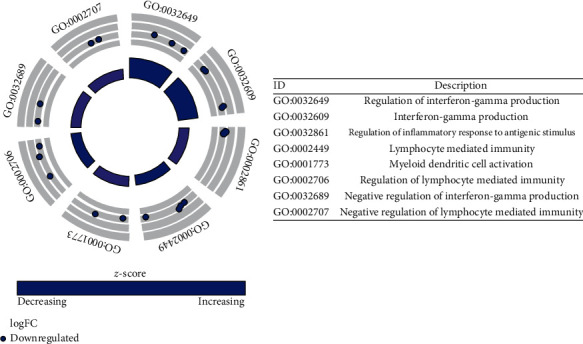
Figure 2.

Functional enrichment analysis of methylation-driven mRNAs in ccRCC. The outer circle represents the expression (logFC) of methylation-driven mRNAs in each enriched GO (gene ontology) term: red dots on each GO term indicate upregulated methylation-driven mRNAs and blue dots indicate downregulated methylation-driven mRNAs. The inner circle indicates the significance of GO terms.
