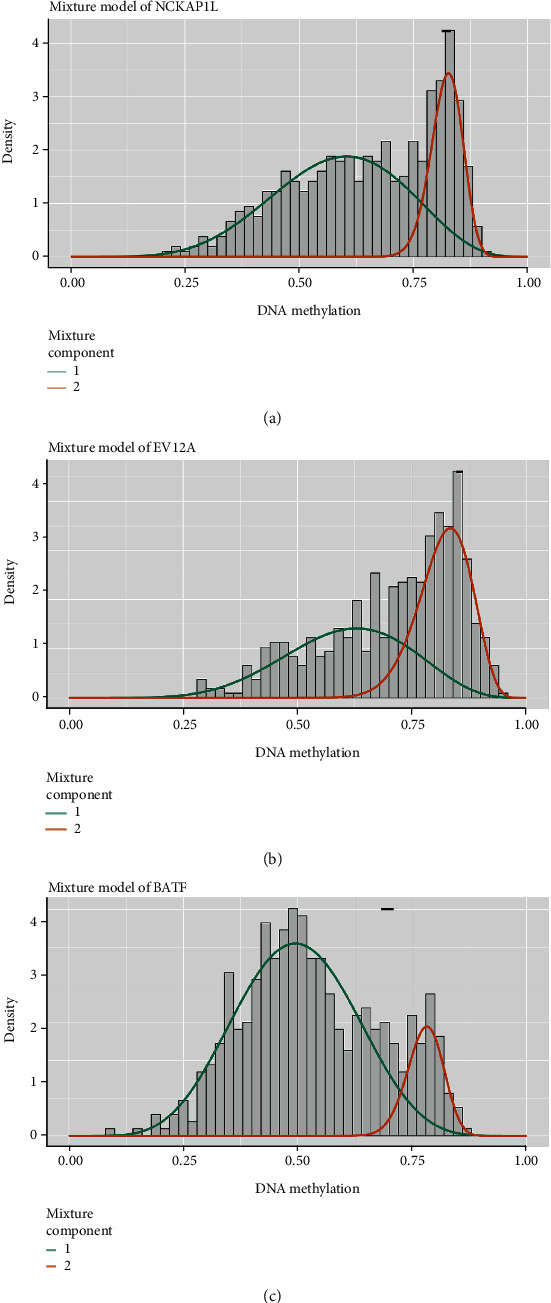
Figure 8.

MethylMix model of three selected DNA methylation-driven genes. The distribution maps show the methylation states of methylated genes. The histogram represents the distribution of methylation in tumor samples. The horizontal black bar demonstrates the distribution of methylation in the normal samples. The distribution of the methylation degree can be clearly seen from (a–c).
