Figure 9.

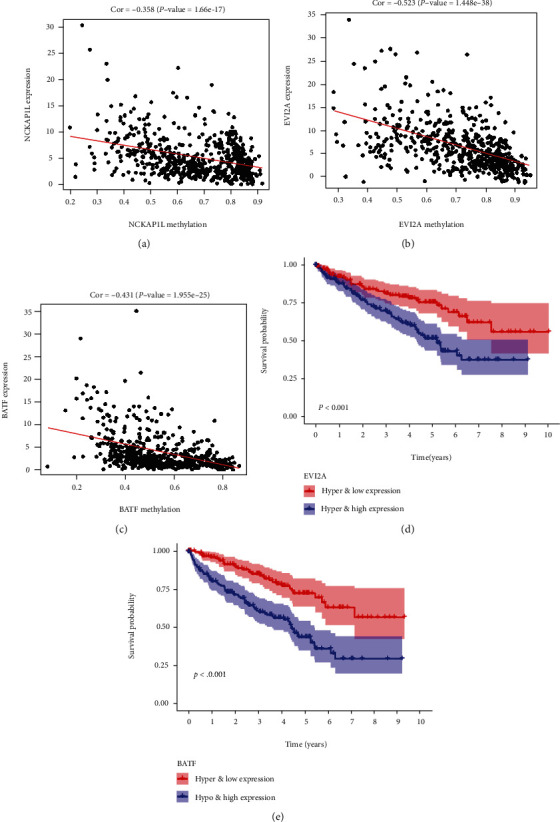
Correlation between DNA methylation and gene expression (a–c) and Kaplan-Meier survival curves for the integrative analysis of EVI2A and BATF (d, e).

Correlation between DNA methylation and gene expression (a–c) and Kaplan-Meier survival curves for the integrative analysis of EVI2A and BATF (d, e).