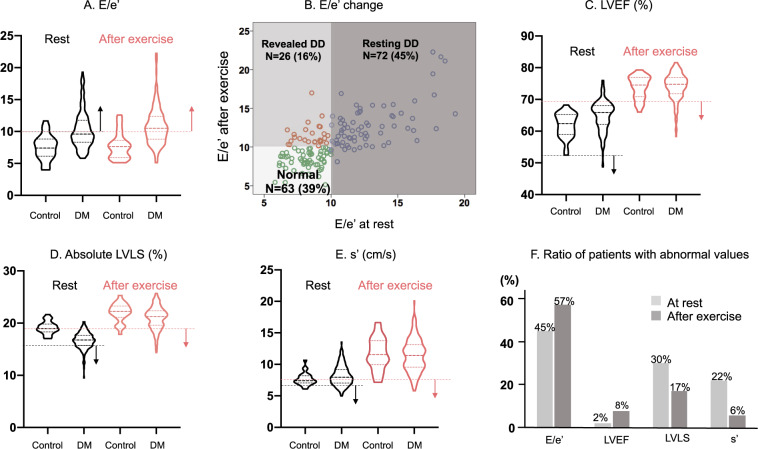
Figure 2.
Comparison of systolic and diastolic function at rest and after exercise between controls and patients with DM. (A) The violin plots of resting (black) and after exercise (red) in E/e′ ratio. (B) The change of E/e′ ratio from rest to after exercises. The green circle represents patients in Normal group, the blue circle represents resting diastolic dysfunction group, and the red circle represents patients in revealed diastolic dysfunction group. (C–E) The violin plots resting (black) and after exercise (red) in LVEF (C), LVLS (D), and s′ (E). (F) The ratio of patients with abnormal diastolic and systolic function at rest and after exercise. LVEF, left ventricular ejection fraction; LVLS, left ventricular longitudinal strain.

