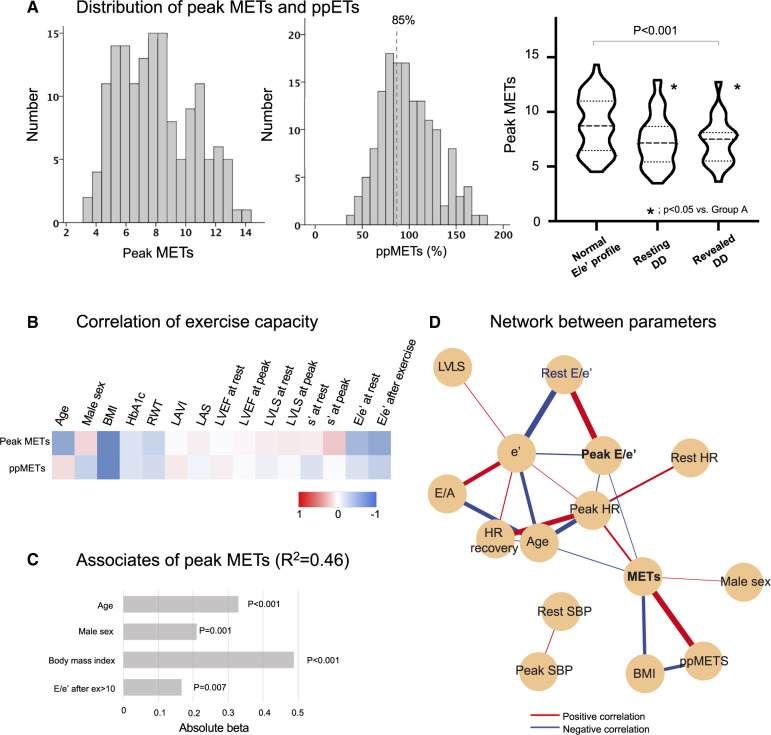
Figure 4.
(A) Distribution of peak METs and ppMETs. (B) A heatmap showing relationship between exercise capacity and characteristics as well as cardiac function at rest and after exercise. The exercise capacity was more related to cardiac function after exercise compared to that at rest. (C) Independent associates of peak METs. (D) Correlation network. BMI, body mass index; HR, heart rate; LAS, left atrial strain; LVEF, left ventricular ejection fraction; LVLS, left ventricular longitudinal strain; METs, metabolic equivalents; RWT, relative wall thickness; SBP, systolic blood pressure; LAVI, left atrial volume index.

