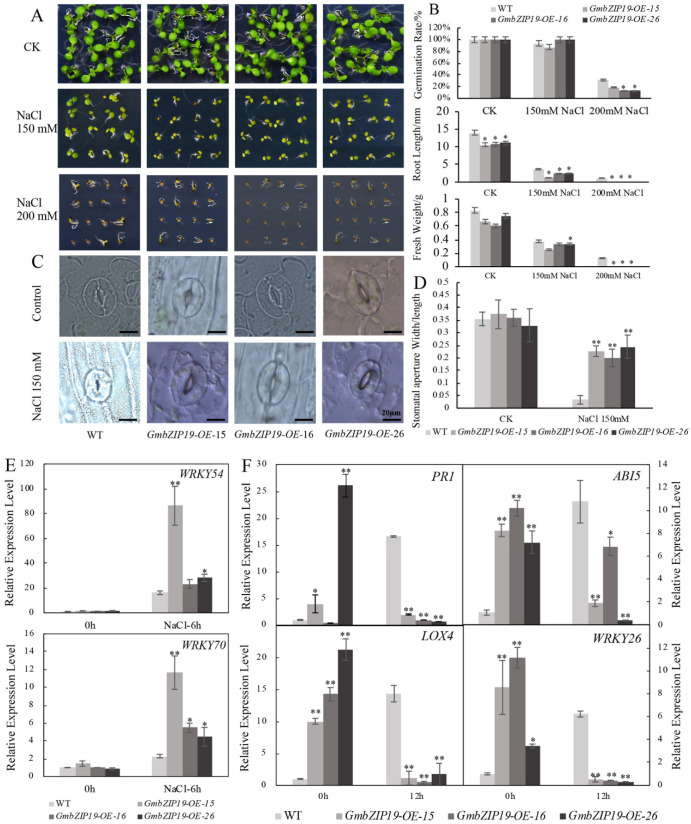
Figure 4.
GmbZIP19-overexpressed plants display sensitivity to salinity. (A) The phenotype of GmbZIP19-OE lines and the WT under 150 mM and 200 mM NaCl. (B) Quantification of the germination rate, root length and fresh weight of GmbZIP19-OE lines and the WT under 150 mM and 200 mM NaCl. The error bars indicate ±SD (n > 10 seedlings). (C) The stomatal aperture phenotype of GmbZIP19-OE lines and WT under 150 mM NaCl. Bar = 20 μm. (D) The quantitative analysis of stomatal aperture of GmbZIP19-OE lines and WT under 150 mM NaCl. (E) The expression levels of stomata movement marker genes in GmbZIP19-OE lines and WT under 150 mM NaCl. (F) The transcription levels of stress-related genes in GmbZIP19-OE lines and the WT under 150 mM NaCl. Three technical replicates were performed for each of the three independent biological replicates. The error bars indicate ±SD (n = 3 replicates). Asterisks indicate significant differences for the indicated comparisons based on a Student’s t-test (** p < 0.01; * p < 0.05).

