Figure 5.
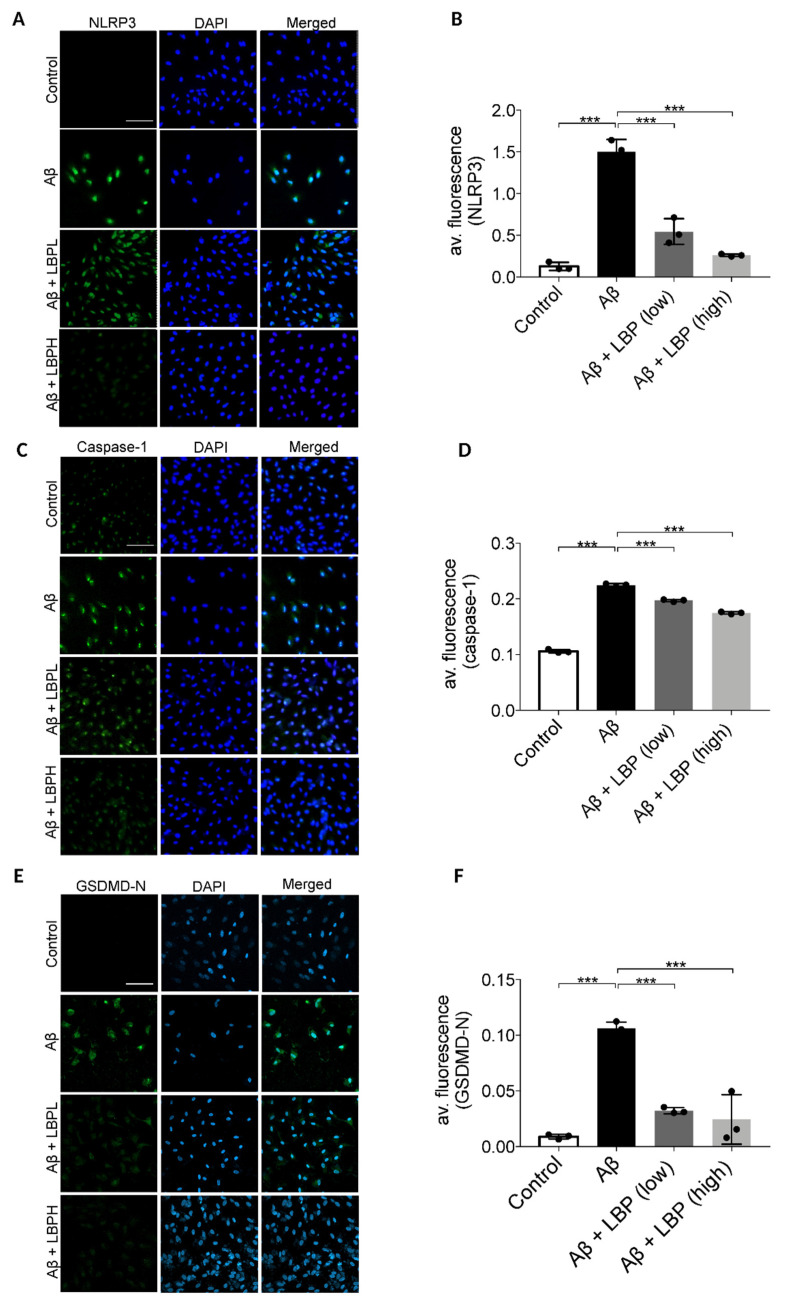
Lycium barbarum polysaccharides lessened the changes in expression of pyroptosis markers (NOD-like receptors protein 3 (NLRP3), caspase-1, and membrane N-terminal cleavage product of GSDMD (GSDMD-N)) in Aβ1-40 oligomers-exposed ARPE-19 cells. (A) Representative immunofluorescence images of NLRP3 (green fluorescence) and DAPI (blue fluorescence) in ARPE-19 cells under different treatments. Aβ1-40 oligomers exposure increased the cellular expressions of NLRP3 (second row). However, the increased expression was subsequently decreased by LBP treatment with both low (3.5 mg/L) and high (14 mg/L) concentration (third row and the fourth row). (B) The histogram indicated the average fluorescence intensity of NLRP3 based on the immunofluorescence results (n = 3, ***p < 0.001). (C) Representative immunofluorescence images of caspase-1 (green fluorescence) and DAPI (blue fluorescence) of ARPE-19 cells in different treatment groups. The expression of caspase-1 in ARPE-19 increased after Aβ1-40 oligomers exposure (second row). Nevertheless, the elevated expression was reduced by LBP treatment with both low (3.5 mg/L) and high (14 mg/L) concentration (third and fourth row). (D) The histogram for the average fluorescence intensity of caspase-1 based on the immunofluorescence data (n = 3, ***p < 0.001). (E) Representative immunofluorescence images showing the expression membrane GSDMD-N (green fluorescence) and DAPI (blue fluorescence) in ARPE-19 cells. There was a remarkable increase in GSDMD-N expression after Aβ1-40 oligomers exposure (second row). Nonetheless, LBP reduced the increased expression at both low (3.5 mg/L) and high (14 mg/L) concentration (third and fourth row). (F) The histogram for the average fluorescence intensity of GSDMD-N based on the immunofluorescence images (n = 3, ***p < 0.001). Scale bar = 100 µm.

