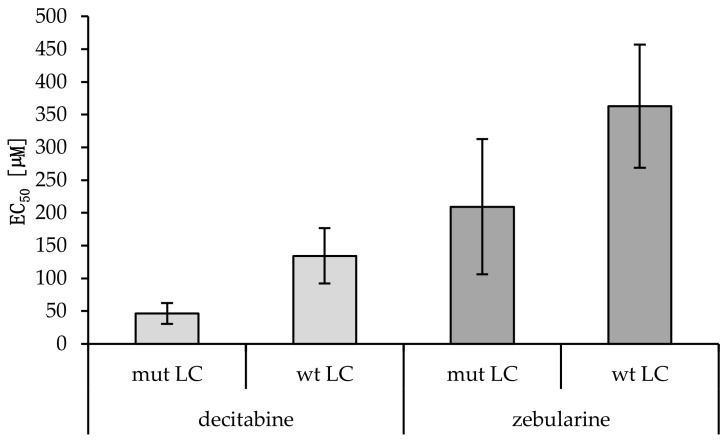
Figure 4.
EC50 values of wild-type versus mutant cancerous cell lines treated with decitabine or zebularine. Averages and standard deviations are shown (nmut LC = 5; nwt LC = 3). A statistically significant difference between the decitabine EC50 values of mut versus wt cell lines was found (p = 0.01, Student’s t-test). No statistical significance was reached for zebularine (p = 0.12; Students t-test).

