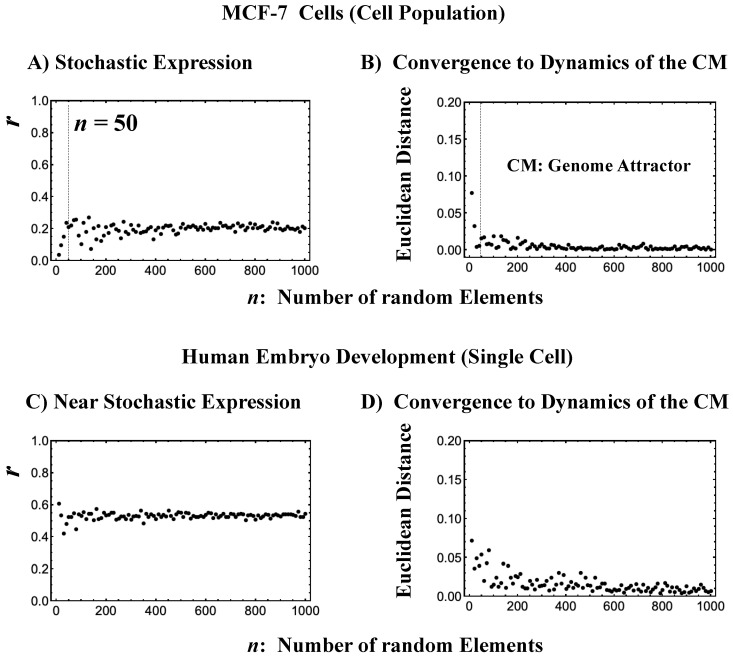
Figure 3.
The center of mass (CM) acting as a genome attractor. MCF-7 cells (microarray data: (A) and (B)) and human embryo development (RNA-Seq data: (C) and (D)). The x-axis represents the number of randomly selected single-gene expression values in all four panels. Panels (A) and (C) illustrate that bootstrapping highlights a low pairwise Pearson correlation (y-axis) in randomly selected groups of expression (computed over experimental time points with 200 repetitions). This confirms the stochastic character of gene expression. Note: In (C), the removal of all genes with zero expression value at a specific cell state in RNA-Seq data does not change their correlation behavior (similar behavior is also observed in the mouse embryo case). Furthermore, the higher correlation in the embryo case makes the convergence to the CM, shown in (D), slower than in the cancer case (B). Panels (B) and (D) illustrate, in terms of Euclidean distance (y-axis; refer to the convergency of critical-state attractors: Section 2.6), the convergence of the dynamics of the CM of a randomly selected group of gene expression to that of the CM of whole-genome expression as the number of selected genes increases (average of 200 repetitions). The CP, the CM of whole-genome expression according to nrmsf, acts as the genome attractor (see Section 2.6 for heteroclinic attractors). Note: For the rest of the biological regulations throughout this report, similar behaviors are observed. The dashed lines in (A) and (B) indicate that coherent behaviors emerge at n = 50 single-gene expression values. Refer to experimental time points in Section 4.1.

