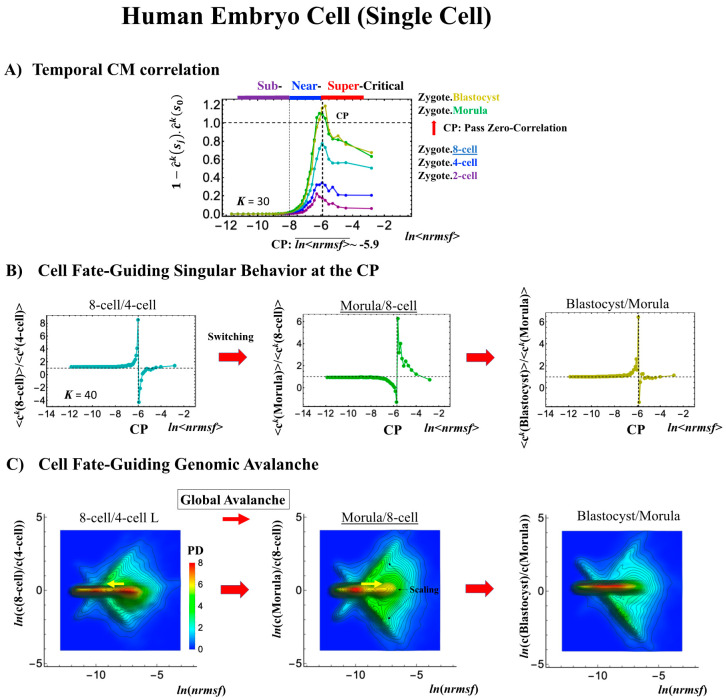
Figure 7.
Human embryonic development (single-cell). The CP corresponds to (A) the peak of temporal CM correlation (see the difference from the cell population in Figure 4A and Figure 5A). A complete erasure of the zygote-CP (genome attractor) occurs after the 8-cell state (K = 30: n = 555 RNAs). Distinct response domains (critical states) as manifested in temporal CM correlations are shown (red: super-critical; blue: near-critical; purple: sub-critical), where the location of the CP lies at the boundary between near- and super-critical states. (B) Switching singular transition at the CP (K = 40: n = 416 RNAs) occurs at each cell state change (only shown from the 4-cell state here). The bimodal folding-unfolding feature at the CP suggests the occurrence of intra-chain segregation in the transition for genome-sized DNA molecules (see more in Section 3.2). (C) A genome avalanche occurs as a traveling density wave along low-expressed genes (around non-fold change: y = 0; the yellow arrow indicates the next direction of travel). Furthermore, three distinct scaling behaviors (linear behaviors in the density profiles in the log–log plot) emerge, which reveals that coordinated chromatin dynamics emerge to guide the reprogramming process. (D) The erasure of zygote criticality after the 8-cell state coincides with the timing of (A) the zero temporal CM correlation through (B) a switching singular transition at the CP. This timing further matches the timing of coherent perturbation of the genome engine passing through the non-equilibrium fixed point (see Section 2.6). Note: A linear behavior emerges in the grouping of randomly shuffled whole-genome expression, as expected; therefore, higher nrmsf is associated with higher expression (see more in Figure 3D in [7]).


