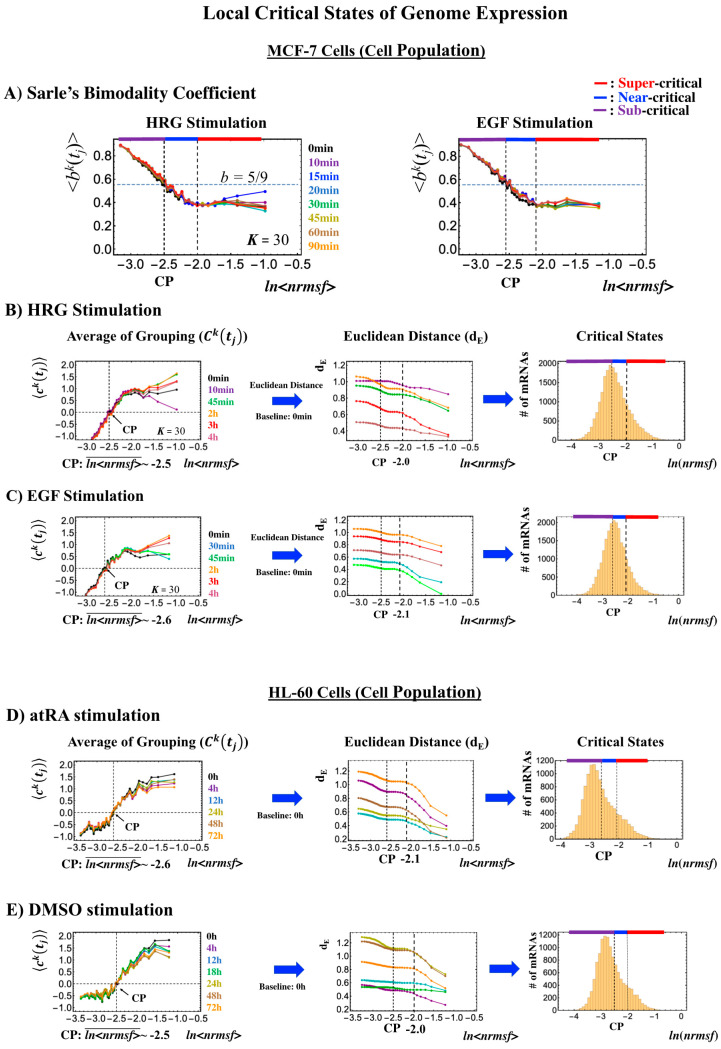
Figure 10.
Systemic determination of local critical states for a cell population (microarray data). (A) In MCF-7 breast cancer cells, Sarle’s bimodality coefficient (b >5/9: onset of bimodal profile) shows that around the CP, a unimodal-to-bimodal transition (from high to low nrmsf) occurs for the group expression profile (K = 30: n = 742 mRNAs), which reveals three distinct profiles (red: super-; blue: near-; purple: sub-critical state) in whole-genome expression (left: HRG stimulation; right: EGF stimulation). To confirm these distinct behaviors (see panels (B) and (C)), which are based on the temporal response of the CM group (first column; refer to Figure 2), we examined the Euclidean distance (second column) between two ensemble averages, < and , (k = 1, 2,…,K = 25) from higher nrmsf, and confirmed three distinct behaviors with a boundary indicated by dashed vertical lines. Similarly, for HL-60 human leukemia cells, the corresponding results are shown for (D) atRA stimulation and (E) DMSO stimulation. In the third column (B–E), the corresponding region of critical states is shown in a histogram of gene expression according to ln(nrmsf). Note: The CP lies at the boundary between near- and sub-critical states, different from the case with a single cell (Figure 7, Figure 8 and Figure 9).

