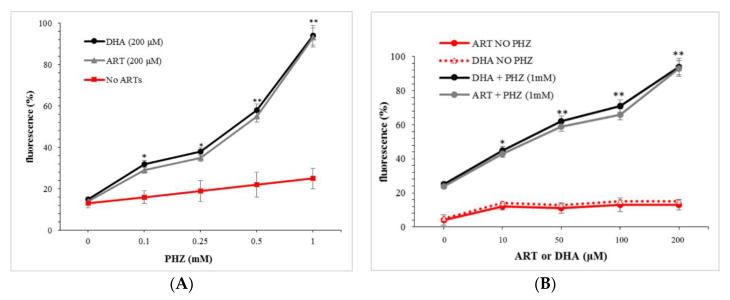
Figure 1.
Reactive oxygen species (ROS) levels measured using CM-H2DCFDA. (A) Red blood cells (RBCs) treated with a fix concentration of artemisinin (ART) and dihydroartemisinin (DHA) (200 μΜ) after pre-treatment with PHZ (0.1–1 mM) and (B) RBCs pre-treated with 1 mM PHZ and then ART or DHA (10–200 μΜ). Data are the average ± SD of 5 independent experiments. Significant differences to untreated RBCs at * p < 0.05; ** p < 0.001.

