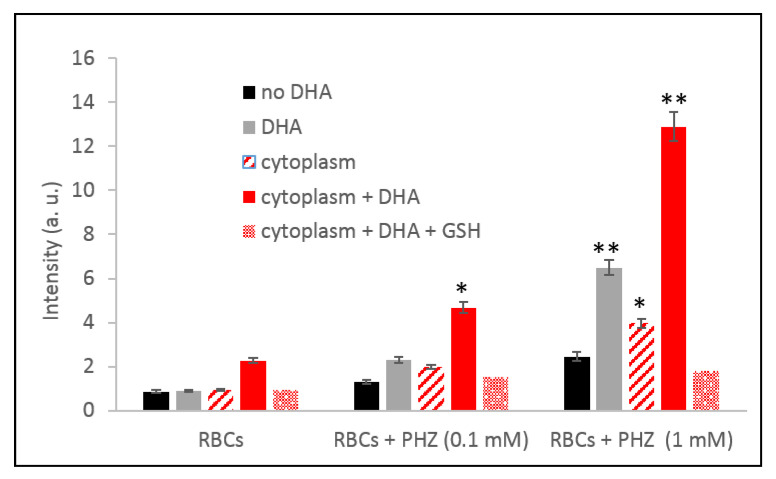
Figure 6.
Production of ROS measured by EPR in PHZ-treated and untreated RBC in the presence of their respective cytoplasm enriched with NADPH (nicotinamide adenine dinucleotide phosphate) or GSH 3 mM. Data are the average ± SD of 5 independent experiments. Significant differences to untreated RBCs at * p < 0.05; ** p < 0.001.

