
Figure 4.
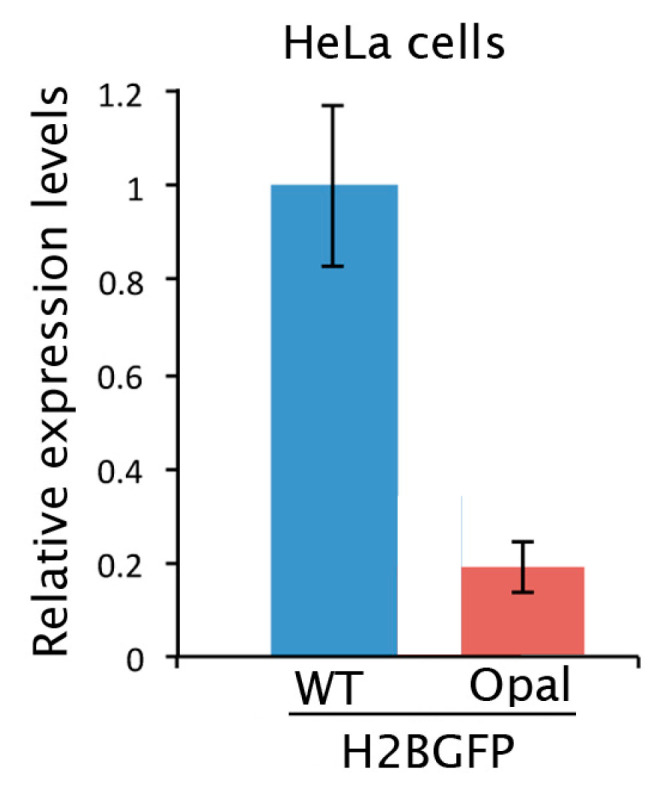
H2BGFP gene expression levels measured by RT-qPCR in HeLa-H2BGFPWT and H2BGFPopal cells. The histogram represents the mean ± SD of a quadruplicate.
Official websites use .gov
A
.gov website belongs to an official
government organization in the United States.
Secure .gov websites use HTTPS
A lock (
) or https:// means you've safely
connected to the .gov website. Share sensitive
information only on official, secure websites.
H2BGFP gene expression levels measured by RT-qPCR in HeLa-H2BGFPWT and H2BGFPopal cells. The histogram represents the mean ± SD of a quadruplicate.