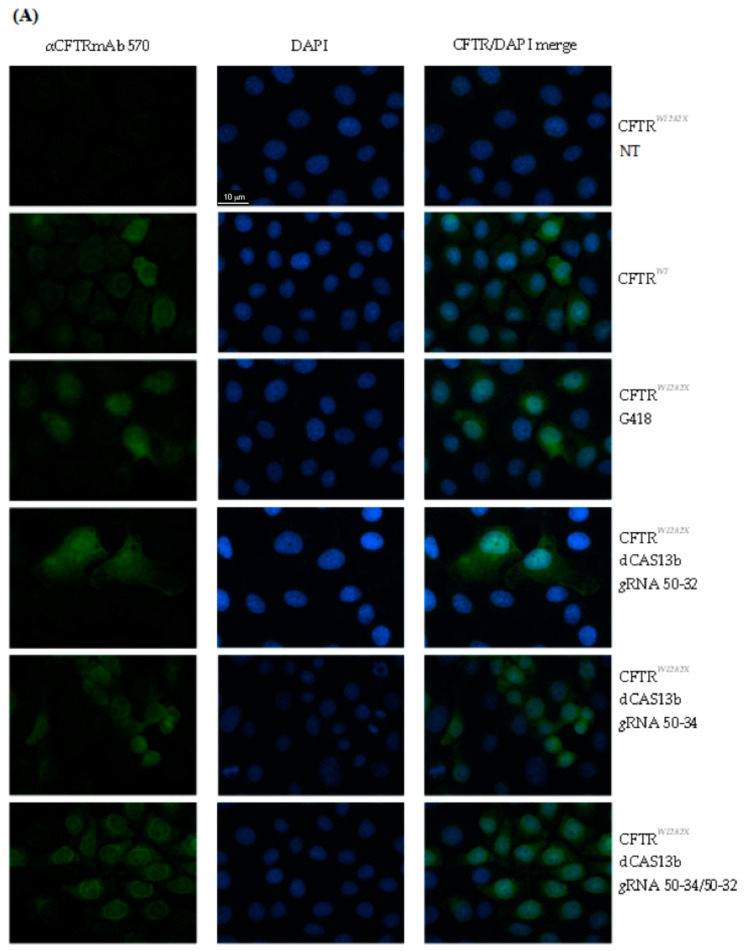
Figure 7.
Immunofluorescence analysis of CFTR protein in triton permeabilized FRT-CFTRW1282X cells and quantification of the immunofluorescence. FRT-CFTRW1282X cells were transfected with the plasmids encoding the indicated gRNAs and dCAS13b/ADAR2DD (300 ng total DNA). Untransfected FRT-CFTRW1282X cells (NT) were used as negative control. FRT-CFTRW1282X cells treated with G418 and FRT-CFTRWT cells were used as a positive control. (A) The CFTR protein was revealed by the primary antibody mAb570, followed by a secondary antibody anti-mouse-FITC conjugated (green, Sigma). Nuclei (blue) were DAPI stained. Images were taken at 63x magnification on a ZEISS microscope equipped for epifluorescence. (B) The quantification is relative to the replicate representative of the results. The error bar represents the standard error of the mean (SEM). The quantification of CFTR signal was done manually by using Fiji software. The cell contour was drawn by using a cell membrane marker. The background was subtracted and the integrated signal intensity in the selected area (one cell) was measured.


