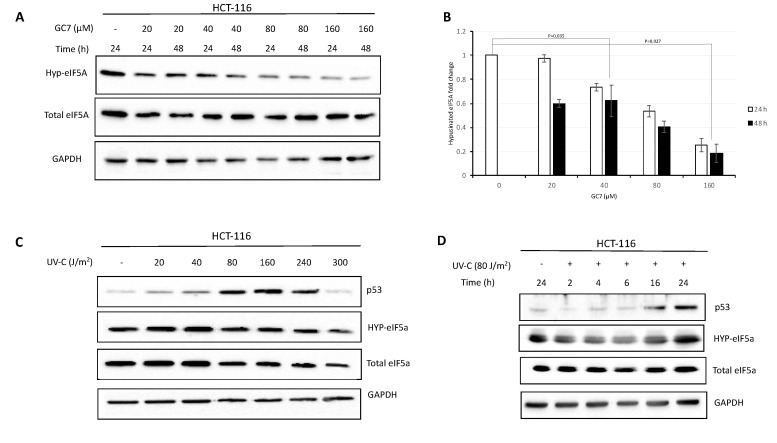
Figure 1.
Dose dependence and time course of the hypusinated eIF5A and p53 protein expression in response to GC7 and UV cell treatment. (A) HCT-116 cells were treated for 24 and 48 h with different concentrations of GC7 as indicated. Expression of hypusinated eIF5A was detected by western blot analysis using a specific polyclonal antibody. (B) Intensity of bands was detected by the Bio-rad Image Lab Software 5.2.1 and the signal of interest was normalized to control GAPDH. The most intensive signal was set as 1. Data are means ± SD (n = 4). p values reported to the upper side of the histograms were calculated versus control group. (C) HCT-116 cells were treated with the indicated doses of UV-C for 24 h. Whole cell extracts were prepared and analyzed by immunoblotting with the antibodies showed in the figure. (D) Kinetics of p53 accumulation were performed treating HCT-116 cells with 80 J/m2 UV-C radiation for the times shown. Whole cell extracts were prepared and analyzed by immunoblotting with the indicated antibodies. A representative image of at least three independent experiments is shown for each analysis.

