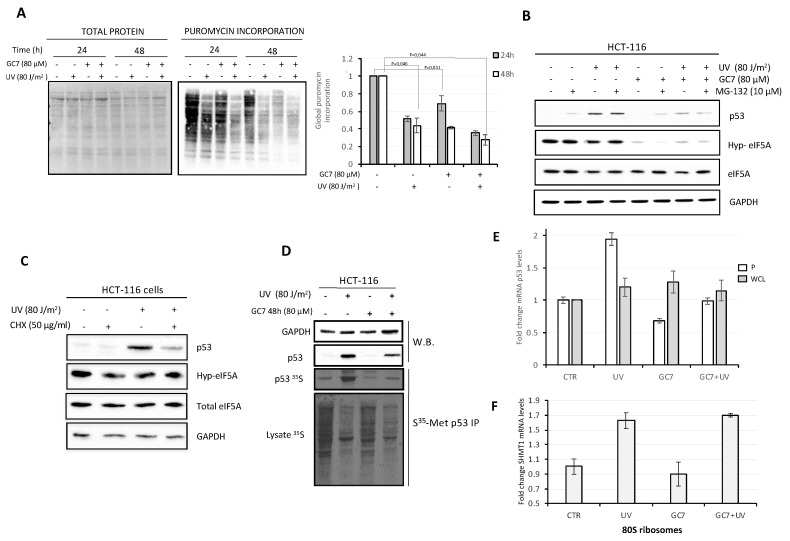
Figure 4.
GC7 inhibits global protein synthesis and perturbs p53 expression at the level of translation. (A) SUnSET assay quantified by histogram on the right. The bar graph summarizes the level of total puromycin proteins measured by densitometry on immunoblottings of three independent experiments and the value of puromycin signal in untreated cells was set as 1. On the left, membrane was stained with Ponceau S solution prior to immunoblotting to verify equal loading of total protein in all lanes. (B) HCT-116 cells were incubated with 10 μM of proteasome inhibitor MG132 for 1 h before to be UV-C irradiated at the indicated dose. When indicated, HCT-116 cells were treated with GC7 for 48 h at the indicated dose (schematic presentation of the experiment in Supplementary Figure S2B). Whole cell extracts were prepared and analyzed by immunoblotting with the indicated antibodies. (C) HCT-116 cells were treated with 50 μg/mL CHX 30 min before UV-C irradiation at the indicated dose. Cells were analyzed 24 h after UV irradiation assessing the levels of indicated proteins by immunoblotting. The expression level was normalized to GAPDH. (D) p53 protein was immunoprecipitated from HCT-116 cells that was labeled with [35S]-methionine 24 h after exposure to 80 J/m2 UV-C and was assessed by autoradiography. Whenever indicated, cells were treated with GC7 24 h before UV-C irradiation. Cells were pre-treated with 10 μM MG132 for 1 h before UV-C irradiation. Immunoblotting showed amount of GAPDH and p53. GAPDH used as loading control. Analysis of whole cell extracts showed decreased amounts of [35S]-methionine incorporated into the irradiated and/or GC7 treated cells (bottom panel). (E) The histograms show the levels of p53 mRNA in ribosome pellet (P) and in whole cell lysate (WCL) fractions of HCT-116 cells treated as described. The bar graphs represent the relative fold changes of target mRNA relative to that of GAPDH and of 18S rRNA for whole cell lysate and ribosomes, respectively. The results are the average of three independent experiments. (F) The histograms show the levels of SHMT1 mRNA in ribosome pellet (80S) of HCT-116 cells treated as described. The bar graphs represent the relative fold changes of target mRNA relative to that of 18S rRNA. The results are the average of three independent experiments.

