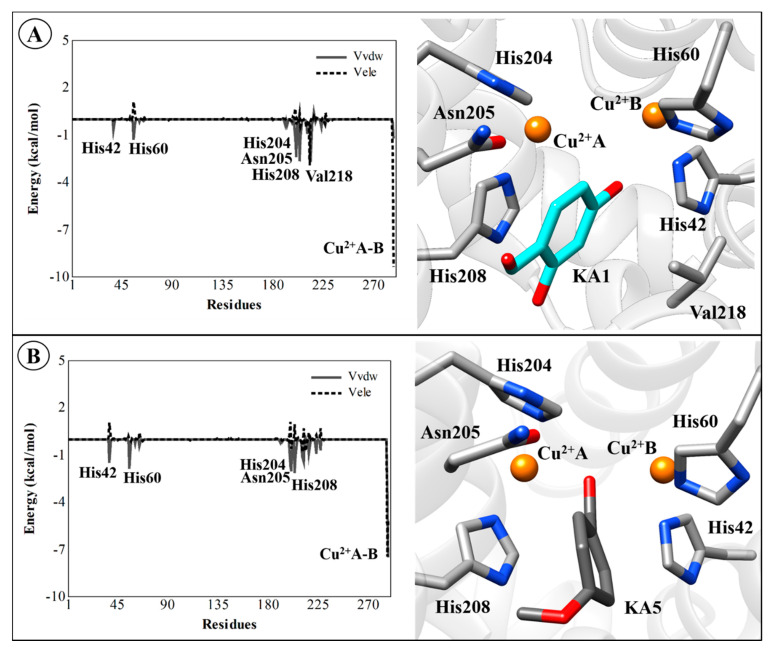
Figure 10.
Average ligand–residue interaction energies (in kcal/mol) overall in compounds used in the linear interaction energy (LIE) calculations for the residues that contribute most to the ligand-surrounding electrostatic (dashed line) and (solid line) van der Waals. (A) TYRBm-KA1 and (B) TYRBm-KA5. The 3D structures of this figure are available in Protein Data Bank (PDB) format in the Supplementary Materials.

