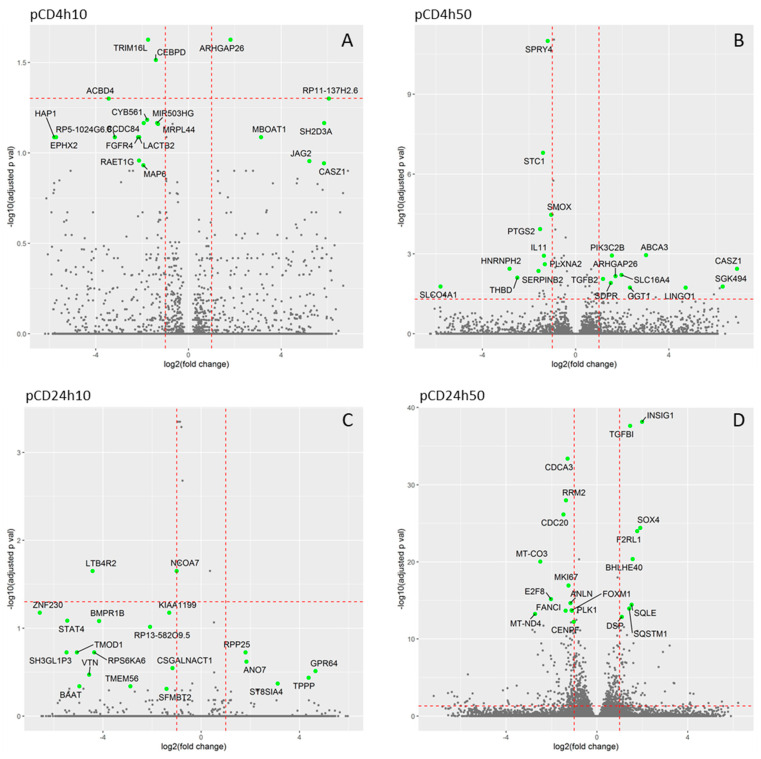
Figure 5.
Volcano scatter-plots showing the relationship between significance and fold change of individual mRNA transcripts expression. The horizontal dashed red line highlights the adjusted p-value of 0.05, the vertical lines denote the fold changes equal of 0.5 and 2. In each plot the 20 most significant transcripts are identified. (A)- pCD4h10, (B)- pCD4h50, (C)- pCD24h10, (D)- pCD24h50.

