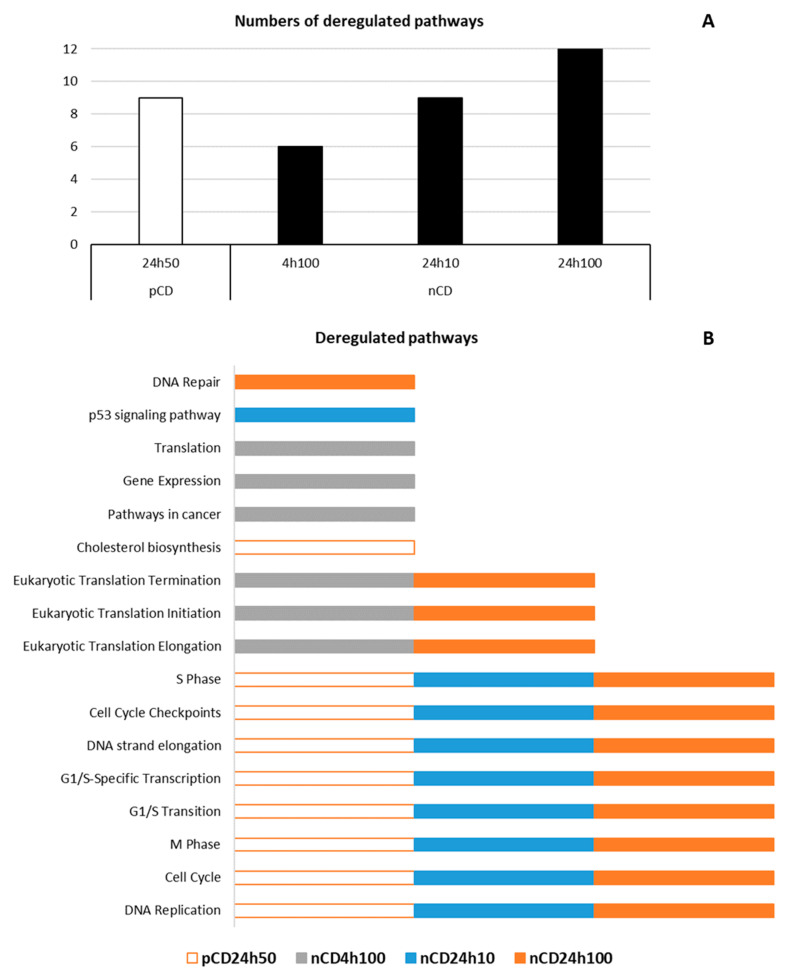
Figure 9.
The graphically illustrated overview of deregulated pathways after CD NPs exposure. (A) indicates the number of deregulated pathways, meanwhile (B) shows in which exposure conditions the selected pathways are deregulated (empty rectangles denote pCD exposure, filled rectangles denote nCD exposure).

