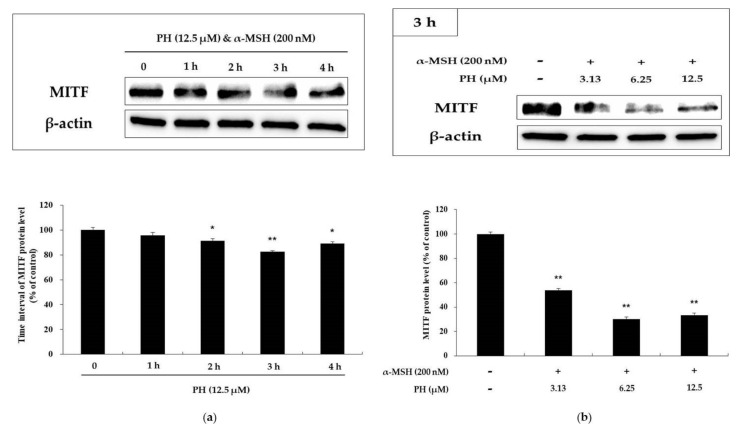
Figure 4.
Effects of PH on MITF expression in B16F10 cells. (a) Cells were treated with 12.5 µM PH at different time intervals. (b) Cells were treated with the indicated concentrations of PH for 3 h. Protein levels were examined by Western blotting. Results are expressed as percentages of the untreated cells. All experiments were carried out in triplicate, and the results are expressed as the mean ± SD. * p < 0.05, ** p < 0.01.

