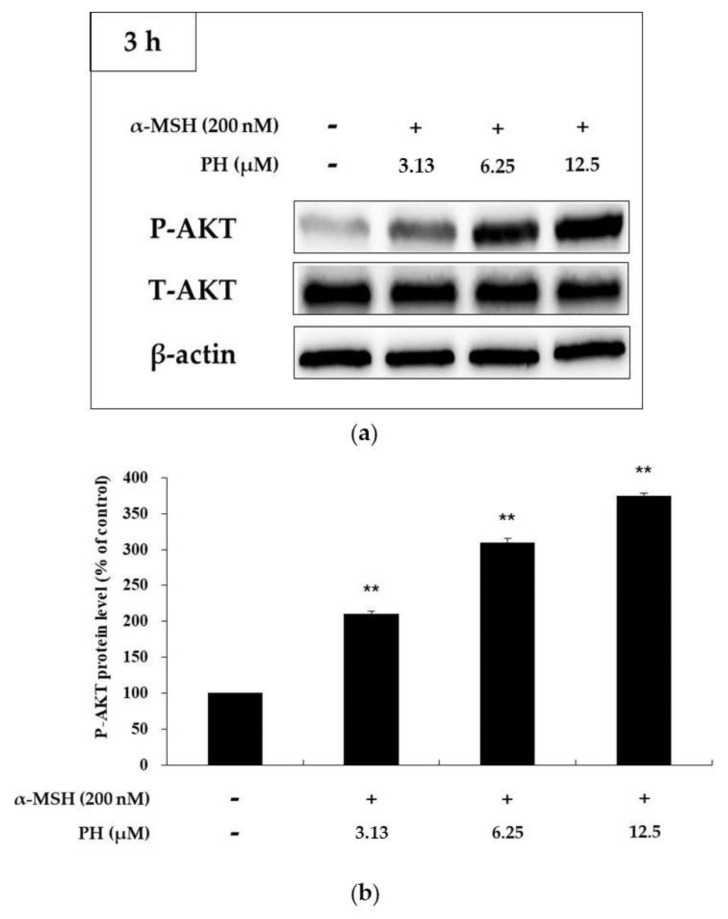
Figure 7.
Effects of PH on AKT phosphorylation. B16F10 cells were treated with PH at the indicated concentrations for 3 h. (a) The Western blotting results and (b) protein levels of p-AKT. Results are expressed as percentages of the untreated cells. All experiments were carried out in triplicate, and the results are expressed as the mean ± SD. ** p < 0.01. P: phosphorylated, T: total.

