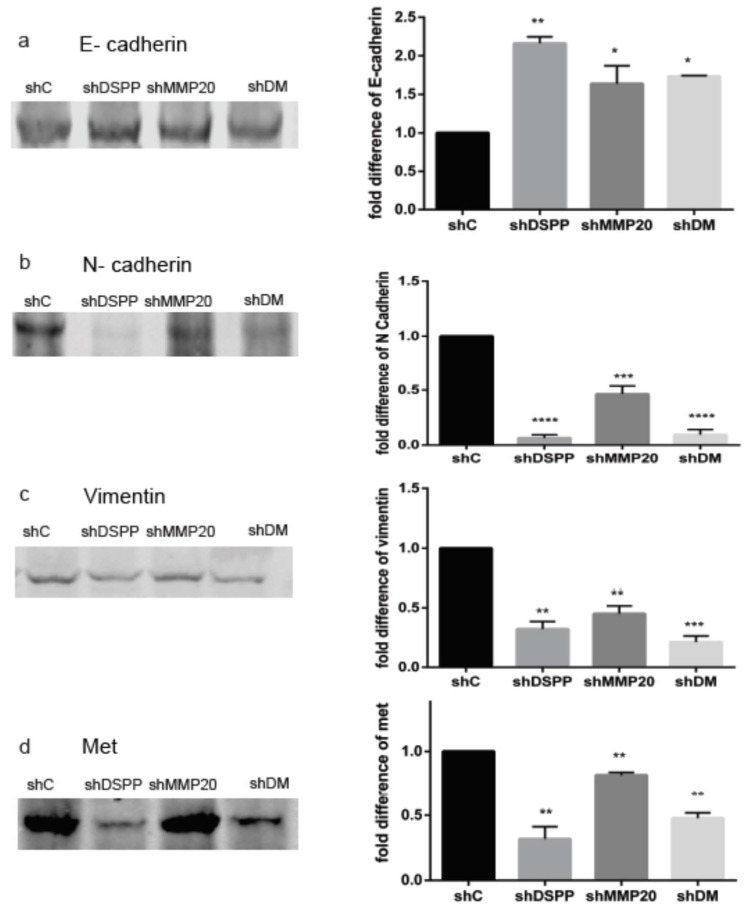
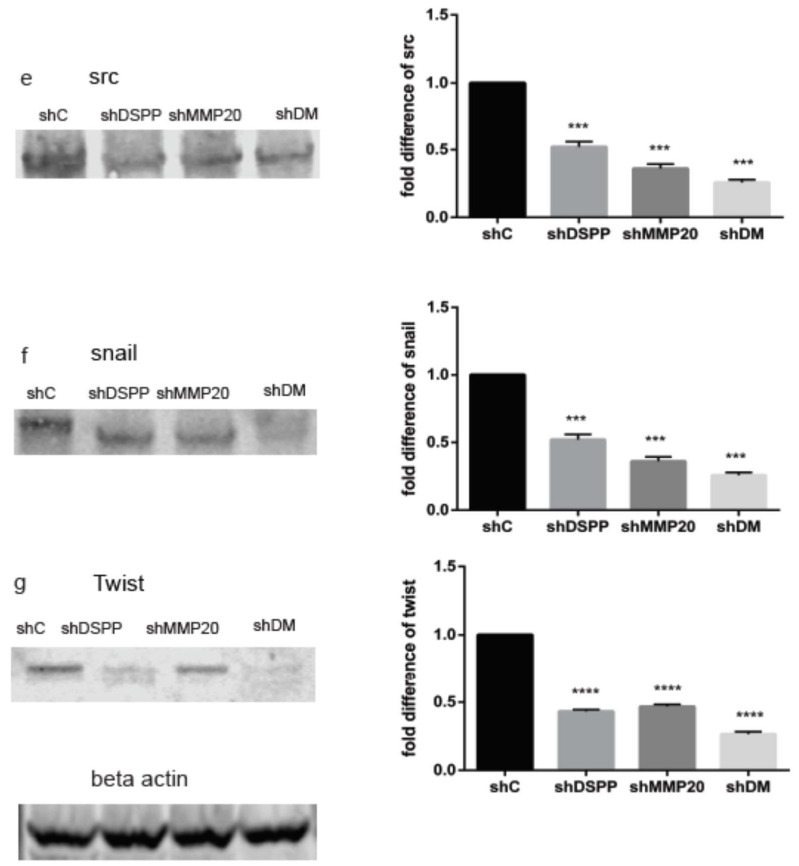
Figure 4.
WB analysis of proteins associated with epithelial-mesenchymal transition. (a) Increase in level of E-cadherin (2-fold in shDSPP, 1.6-fold in shMMP20, and 1.8-fold in shDM (p < 0.01, p < 0.05, p < 0.05, respectively) when compared to the control. (b) Decreased N-cadherin in shDSPP (93%), shMMP20 (54%), and shDM (84%) were significant (p < 0.05) when compared to the control. (c) Decreased vimentin in shDSPP (73%), shMMP20 (55%), and shDM (79%) were significant (p < 0.01, 0.001) when compared to the control. (d) Downregulation of met in shDSPP (80%), shMMP20 (30%), and shDM (47%) were significant (p < 0.01) when compared to the control. (e) Downregulation of src (Figure 4e) in shDSPP (60%), shMMP20 (75%), and shDM (85%) were significant (p < 0.01) when compared to the control (f) Downregulation of snail in shDSPP (46%), shMMP20 (60%), and shDM (74%) were significant (p < 0.05) when compared to the control. (g) Downregulation of twist in shDSPP (44%), shMMP20 (50%), and shDM (70%) were significant (p < 0.001) when compared to the control. Beta actin was used as the internal control. Values are given as mean ± SE for 3 independent experiments. shC = Scrambled Control; shDSPP = DSPP Silenced OSC2 cells; shMMP20 = MMP20 Silenced OSC2 cells; DM = Combined DSPP–MMP20 Silenced OSC2 cells; *p < 0.05; ** p < 0.01; *** p < 0.001; **** p < 0.0001.


