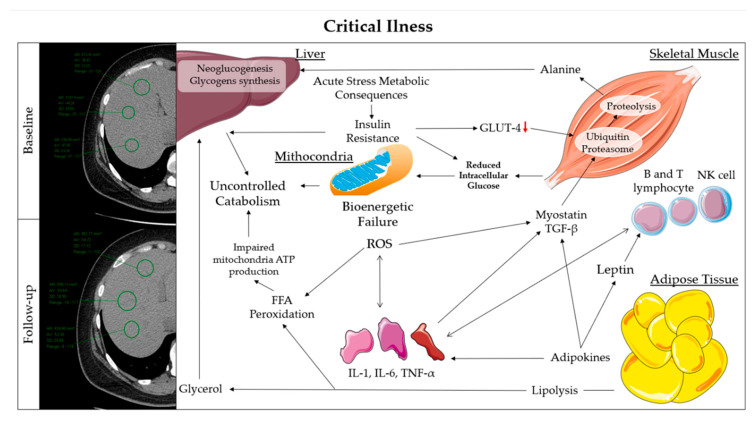
Figure 2.
(Right) representation of metabolic pathways in response to critical condition. (Left) difference to CT images of liver attenuation between baseline and follow-up. FFA: Free Fatty Acids; GLUT: Glucose Transporter; IL: Interleukin; NK: Natural Killer; ROS: Reactive Oxygen Species; TGF: Transforming Growth Factor; TNF: Tumor necrosis factor.

