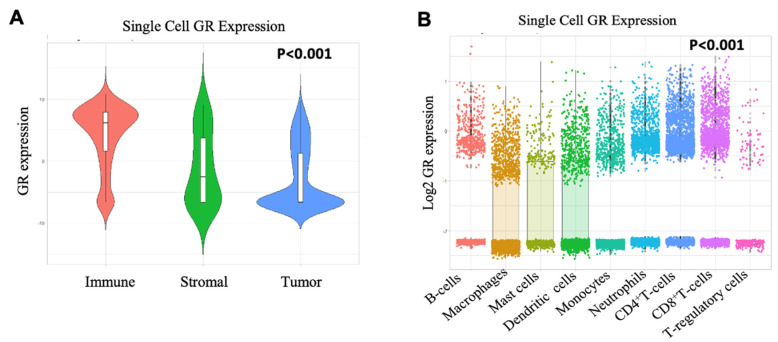
Figure 2.
Single cell sequencing data of primary breast cancer. (A) GSE75688 shows that immune cells have higher GR expression than tumor and stromal cells. Data compiled from GSE cited was used to perform one-way ANOVA across all cell subsets. The p value is for the F statistic within ANOVA. (B) GSE114725 shows that CD8+ T-cells have higher GR expression than other immune cell subsets. Data compiled from GSE cited was used to perform one-way ANOVA across immune cell subsets. The p value is for the F statistic within ANOVA. Bonferroni correction was used to compare CD8+ T-cells to other immune cell subsets with higher average mean in post-hoc analysis.

