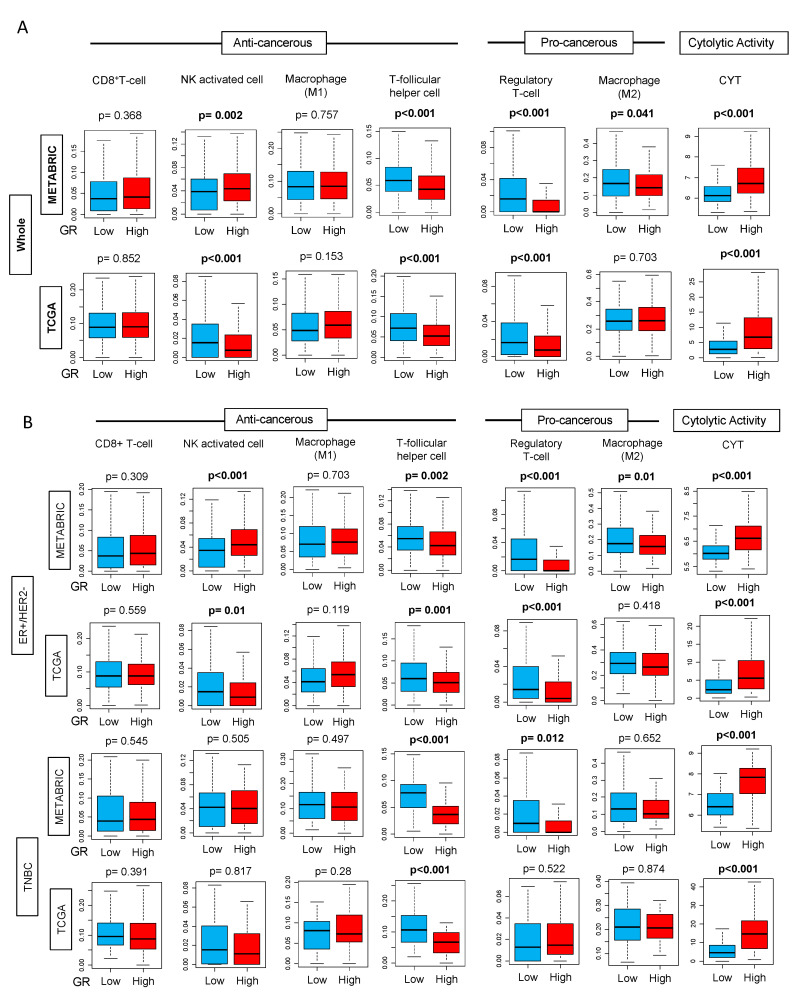
Figure 4.
Tukey boxplots of immune cells CD8+ T-cells, Natural Killer (NK) activated cells, M1 and M2 macrophages, T-follicular helper cells, T-regulatory cells, and cytolytic activity (CYT) in GR-high and GR-low breast cancer using CIBERSORT algorithm in METABRIC and TCGA cohorts (A) in the entire cohort (Whole) and (B) in estrogen receptor (ER)-positive/human epidermal growth factor receptor (HER2)-negative and triple negative (TNBC) subtypes. The cut-off of top and bottom quartile of NR3C1 expression was considered as GR high and GR low in the entire cohort and also in the respective subtypes. Y-axis shows the fraction of cells with GR-low or GR-high expression. Boxes depict medians and interquartile ranges. Depicted p values are calculated using one-way ANOVA.

