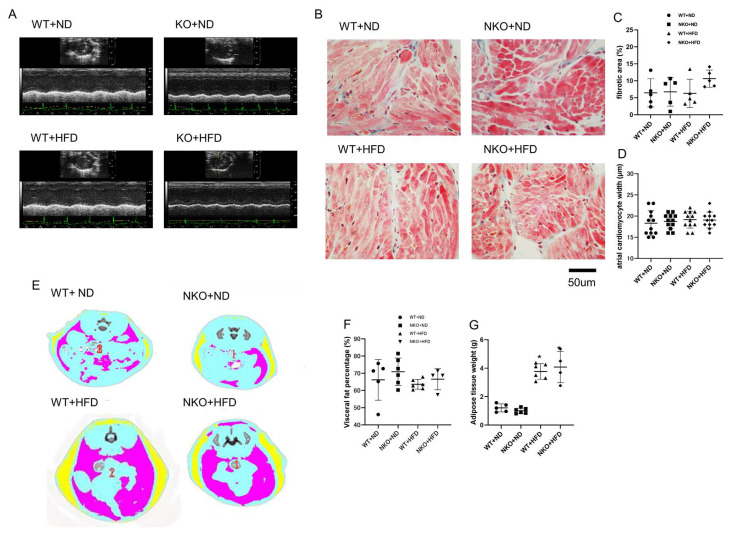
Figure 2.
Echocardiography, histology, and adipose tissue measurements. (A) Representative M-mode echocardiographic images of a mouse heart. (B) Representative images of Masson trichrome staining of the atrial tissues. (C) Ratios of fibrotic area to total area (n = 5 mice per group). (D) calculated atrial cardiomyocytes width (n = 12 cells in 3 mice per each group). (E) Representative images of abdominal CT scans. Yellow: subcutaneous adipose tissue; pink: intestinal (visceral) adipose tissue. (F) Visceral adipose tissue weights measured by abdominal CT scans. (G) Subcutaneous adipose tissue weight measured by abdominal CT scan (n = 5 mice in WT+ND group, n = 6 in NKO+ND group, n = 6 in WT+HFD group, n = 4 in NKO+HFD group). *p < 0.05 vs. WT+ND mice. Statistical comparisons between multiple groups: one-way ANOVA followed by a post-hoc Bonferroni test.

